Cedar Key

About Cedar KeyCedar Key is a small coastal village approximately 80 miles north of Tampa, on Florida's Gulf Coast. Although the town contains less than 1,000 full-time inhabitants, this community is a place of historic significance. The area contains a rich heritage of both Native American and European history, as early settlers occupied this region several thousand years ago and European settlement pre-dates the Civil War. Local industry in the 19th and 20th century included timber harvesting, fishing, and eventually tourism.
|
Storm Surge HistoryCedar Key is vulnerable to coastal flooding, as it is located near Apalachee Bay, a location susceptible to large surges. However, powerful hurricanes rarely make landfall in this region, so large surges are infrequent. Scientific/historical literature provide high-water levels for 34 tropical surges since 1880, the highest of which was an 10-ft storm surge from an unnamed hurricane in 1896. This region is also susceptible to coastal floods in winter and spring; strong winds behind the "Storm of the Century," in March, 1993, produced the highest water levels on record in some nearby locations.
|
Data Selection
Cedar Key storm surge data come from a compact data-selection circle with a 2-mile radius centered on [Lat: 29.135N, Lon: 83.032W]. Data are provided by the NOAA tide gauge, as well as other scientific and anecdotal sources.
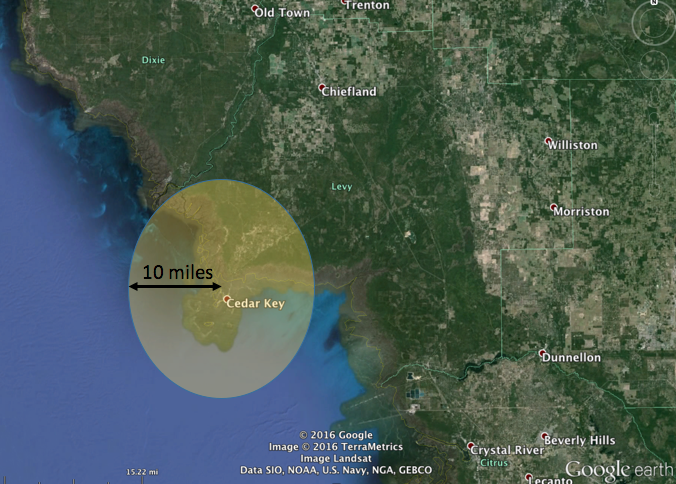
The Cedar Key data selection circle is centered on the following coordinates:
Lat: 29.1642; Lon: -83.0457
Lat: 29.1642; Lon: -83.0457
1. Tide Gauge Data
Verified Hourly Water Level Data from NOAA Tides and Currents
January 1, 1997- Present
Verified 6-min Water Level Data from NOAA Tides and Currents
January 2, 1997-Present
Coordinates: Lat: 29.135N, Lon: 83.0317W
Link: https://tidesandcurrents.noaa.gov/waterlevels.html?id=8727520
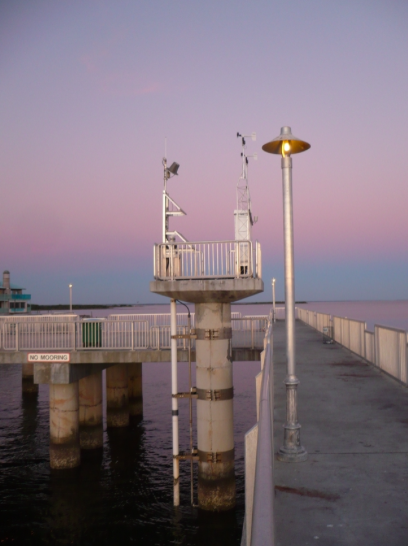
The NOAA/NOS Tide Gauge at Cedar Key, Florida
2. Other Scientific Sources
See Needham and Keim (2012) for other scientific sources used to build Cedar Key storm surge data.
3. Anecdotal Sources
See Needham and Keim (2012) for anecdotal sources that were helpful for building Cedar Key storm surge data.
Graphics
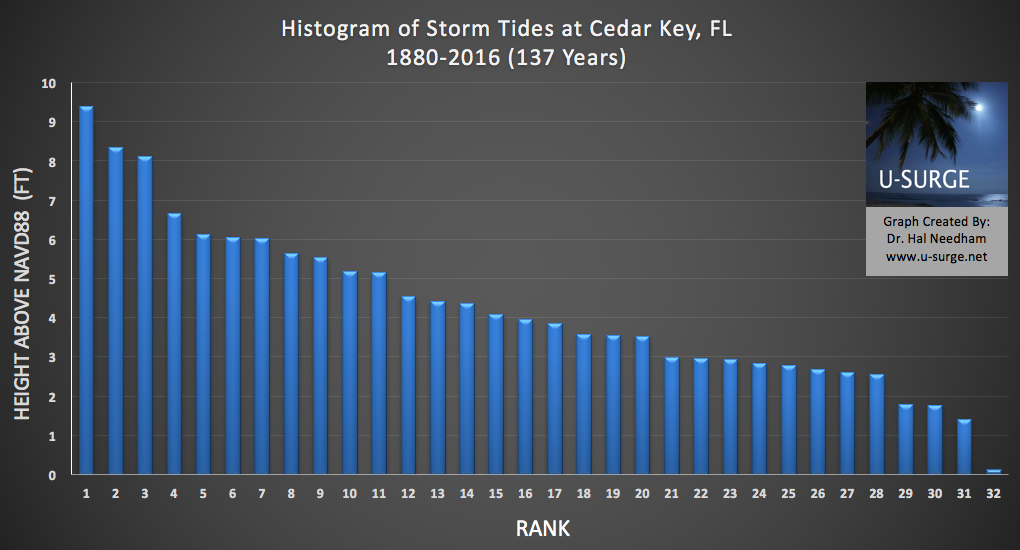
This histogram provides the maximum water levels of the 32 recorded coastal flood events in Cedar Key since 1880. The events are ordered from the highest water level (Rank = 1) to lowest (Rank = 32). These events are not placed in chronological order.
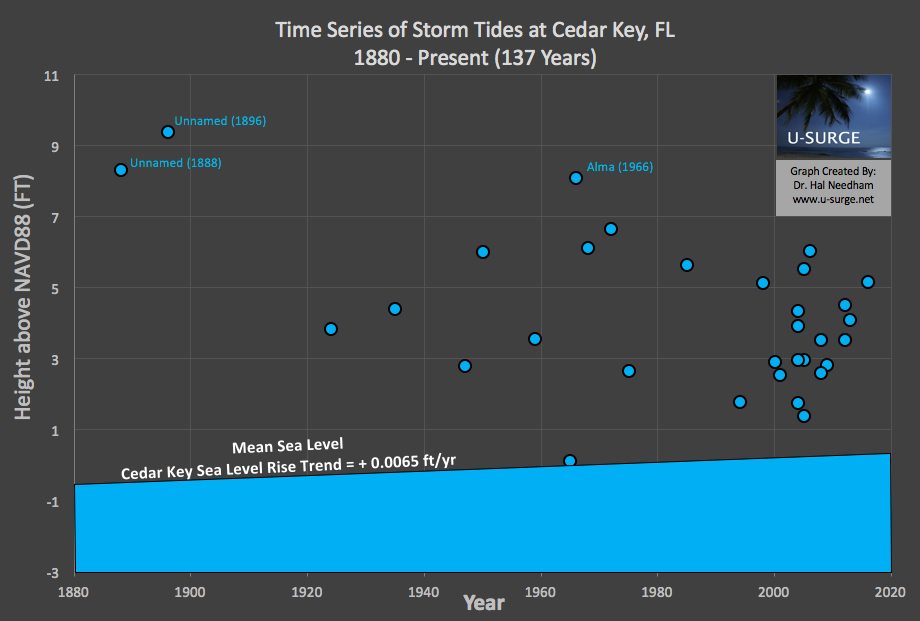
This time series provides the maximum water levels of 32 recorded tropical surge events at Cedar Key since 1880. These events are ordered chronologically from oldest (left) to newest (right). Consistent tide-gauge data are available at this site since 1997, which explains, in part, the numerous low-magnitude observations since that time.
Statistical Extreme Water Levels
Flood Impact Mapping
Missing Data
The following hurricanes may have generated storm surges exceeding 4 ft (1.22 m) near Cedar Key, but a literature review does not yet provide data. We have identified 14 storms that are missing storm surge data from 1880- present. The maps are provided by Unisys Corporation.
October 5-10, 1880
October 5-15, 1882
October 8-14, 1885
June 17-24, 1886
June 27 - July 2, 1886
July 14-24, 1886
June 15-20, 1889
June 12-20, 1893
October 2-8, 1899
October 10-15, 1900
June 12-17, 1902
August 31 - September 6, 1915
September 25-30, 1920
October 20-30, 1921
Multi-Media
Hurricane Hermine (2016)
This video shows the fast flow of storm surge, which is a good reminder because sometimes we think of storm surges only as vertical water rise, not a rapid flowing of water inland from the sea.
This video has excellent storm surge footage in Cedar Key
Tropical Storm Colin (2016)
Tropical Storm Andrea (2013)
Tropical Storm Debby (2012)

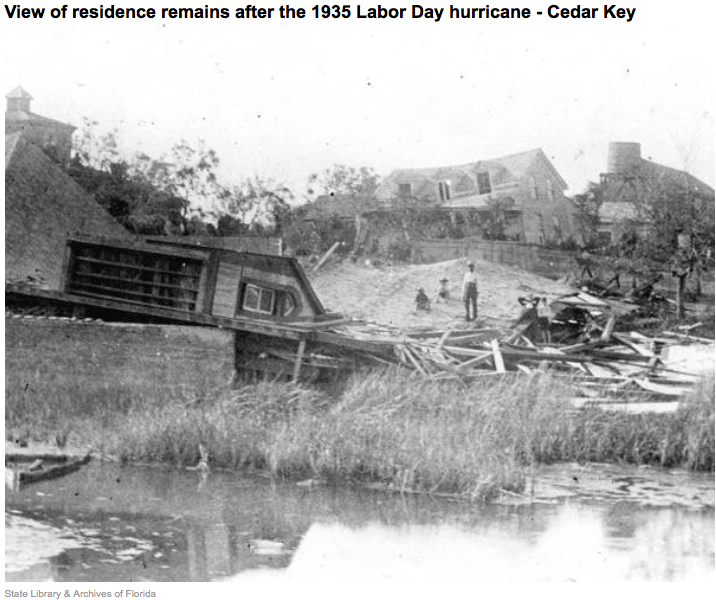
Labor Day Hurricane (1935)