Apalachicola
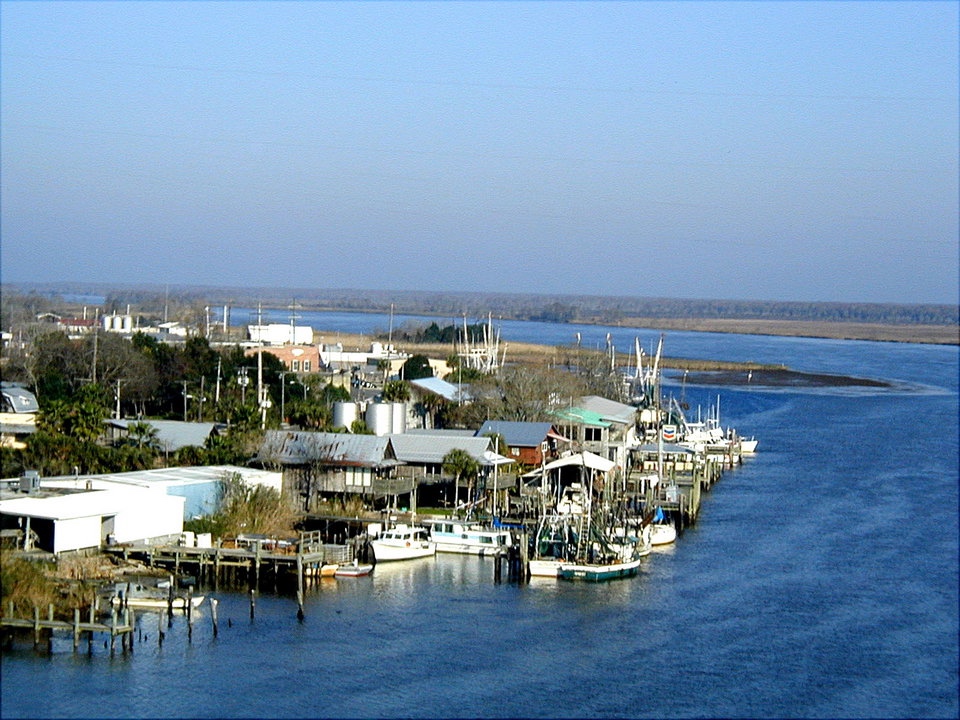
About ApalachicolaApalachicola is the county seat of Franklin County, Florida. The city was first settled as a British trading post, called Cottonton, adjacent to the mouth of the Apalachicola River. At the 2010 U.S. Census, the city's population was 2,231, or approximately 1,000 people less than its maximum population in 1940. Oyster and shrimp harvesting are mainstays of Apalachicola's economy; approximately 90% of Florida's oyster production comes from Apalachicola Bay. However, yields have declined somewhat in recent years.
|
Storm Surge HistoryScientific and historical literature provide maximum water levels for 38 storm surge events at Apalachicola since 1900. Water levels reached 10 ft (3.05 m) on two separate occasions; an unnamed hurricane in 1903 produced a 10-ft storm tide, followed by Hurricane Elena, which produced a 10-ft storm surge in 1985. Models suggest that Apalachee Bay, a large body of water east of Apalachicola, has the potential to observe some of the highest storm surge levels in the U.S., however, a large or powerful hurricane would need to make landfall near Apalachicola, which is rare in hurricane climatology.
|
InfoGraphics
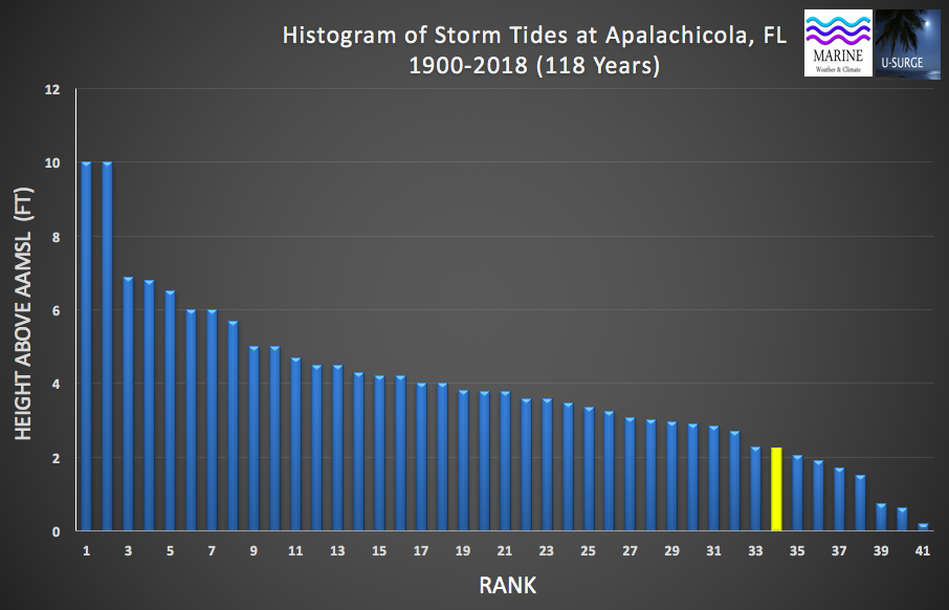
The U-Surge Project has identified 41 tropical surge events at Apalachicola since 1900. This histogram ranks the water levels from highest (Rank = 1) to lowest (Rank = 41). These events are not placed in chronological order and they have been detrended to remove sea-level rise. As of 500AM Tue Oct 09, Michael's storm surge ranks 34th all-time.
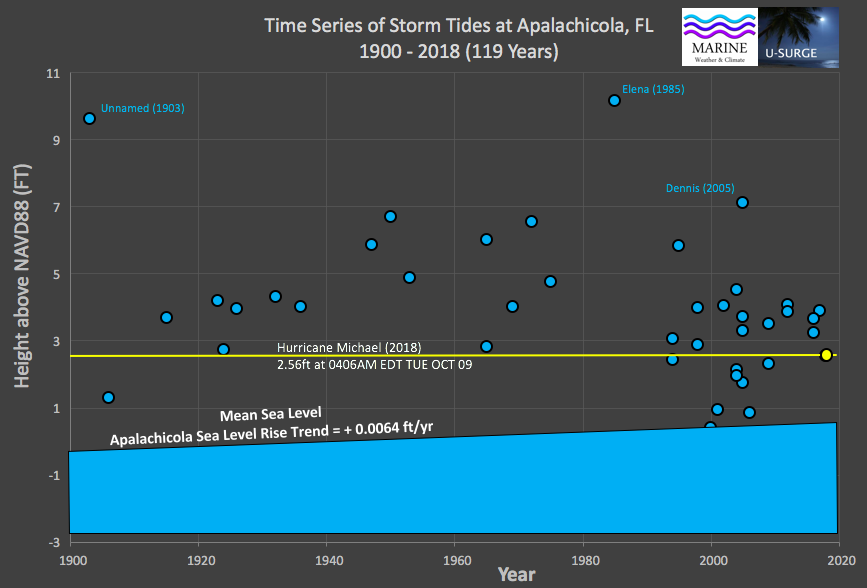
This time series provides the maximum water levels of 41 recorded tropical surge events in Apalachicola since 1900. These events are ordered chronologically from oldest (left) to newest (right). The numerous low-magnitude events from 1996- present are influenced by both climate and data availability, as a NOAA tide gauge at this location provides data since 1996. As of 0500AM EDT on Tue Oct 09, Hurricane Matthew's water level ranked 32nd. It will rise quickly through the ranks over the next 24 hours.
Maps of the Highest Storm Surges
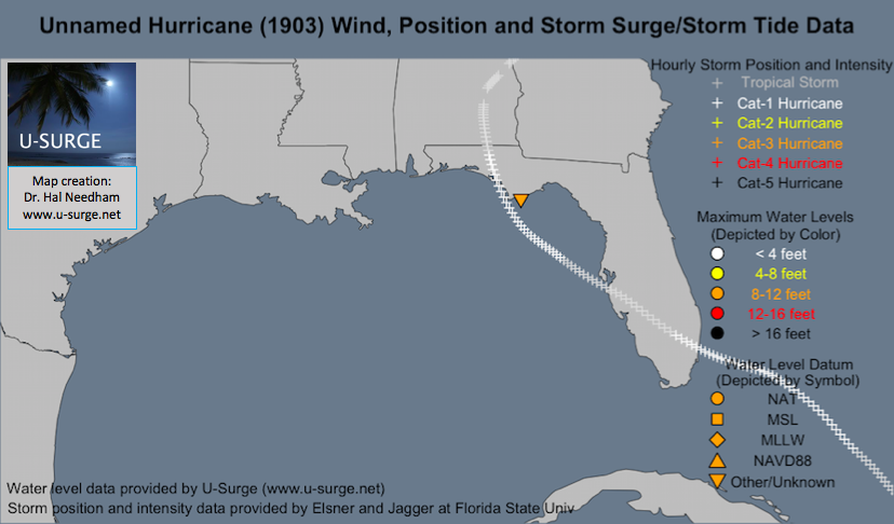
An unnamed hurricane in 1903 generated a 10-ft (3.05 m) storm tide above an unknown datum at Apalachicola. This ties
for the highest magnitude coastal flood event on record in this location.
for the highest magnitude coastal flood event on record in this location.
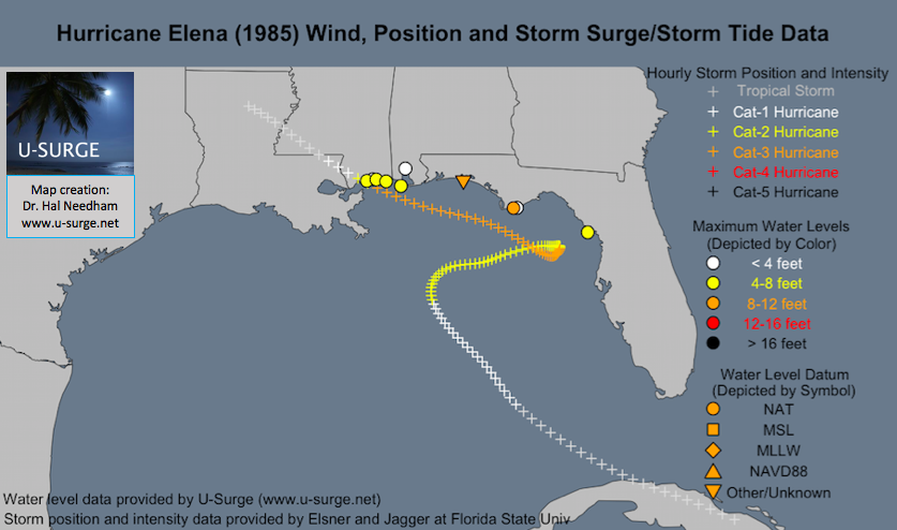
Hurricane Elena (1985) generated a 10-ft (3.05 m) storm surge in Apalachicola. This ties for the highest magnitude
coastal flood event on record in this location.
coastal flood event on record in this location.
Data Sources
1. Tide Gauge Data
Verified Hourly Water Level Data from NOAA Tides and Currents
April 1, 1976- Present
Verified 6-min Water Level Data from NOAA Tides and Currents
January 1, 1996-Present
Coordinates: Lat: 29.725N, Lon: 84.98W
Link: https://tidesandcurrents.noaa.gov/stationhome.html?id=8728690
2. Other Scientific Sources
See Needham and Keim (2012) for other scientific sources used to build Apalachicola storm surge data.
3. Anecdotal Sources
See Needham and Keim (2012) for anecdotal sources, such as newspaper archives, that were helpful for building Apalachicola storm surge data.
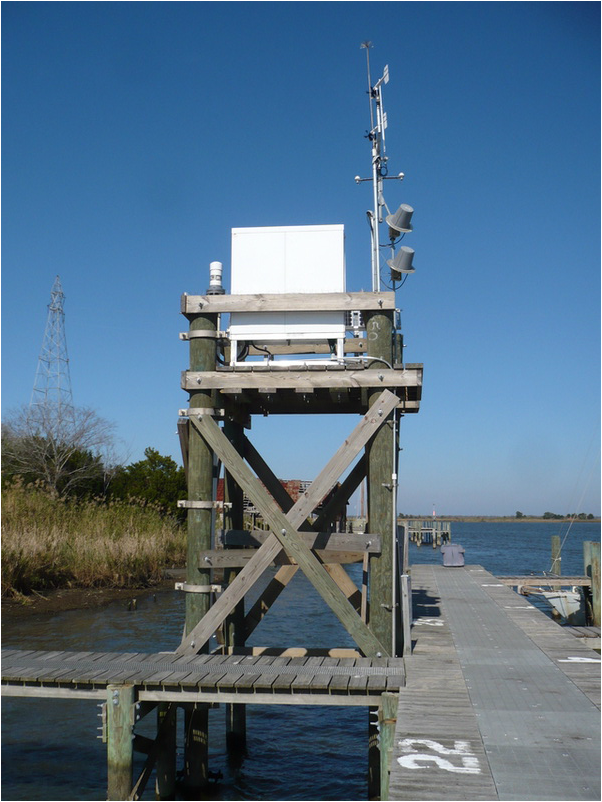
The NOAA tide gauge at Apalachicola provides hourly and 6-min water levels since January 1, 1996.
Data Selection
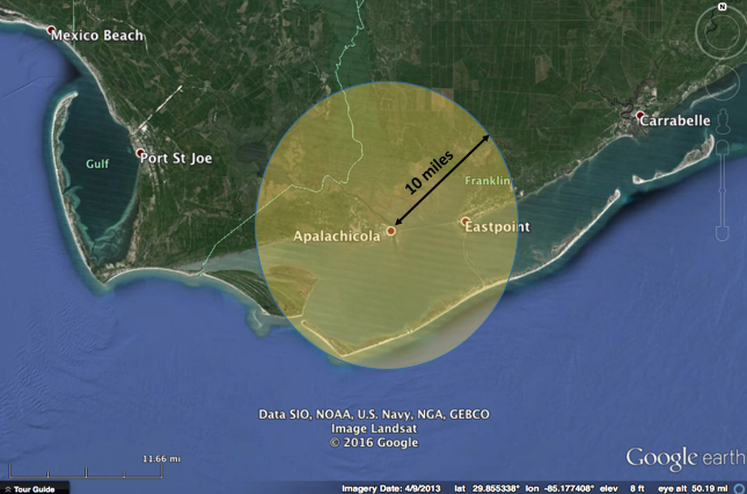
The Apalachicola data selection circle is centered on the following coordinates:
Lat: 29.7286; Lon: -84.9847
Lat: 29.7286; Lon: -84.9847
Ideally, storm surge data would be taken from long-term tide gauges. Unfortunately, this is not possible for several reasons:
1. The record length of most tide gauges is not long enough to capture more than several decades of data (there are a few exceptions)
2. Large storm surges exceeding 10 ft (3.05 m) often destroy tide gauges
3. Storm surge is a localized phenomenon, with surge heights often changing considerably over several miles. Therefore, tide gauges usually do not pick up the peak storm surge because the network of gauges is not dense enough
Considering these problems, U-Surge utilizes a circle with a 10-mile (16-km) radius for data capture. This area is optimal, as larger circles capture more data but decrease data homogeneity, but smaller circles do not capture enough observations.
Missing Data
The following hurricanes may have generated storm surges exceeding 4 ft (1.22 m) at Apalachicola, but a literature review does not yet provide data. We have identified 18 storms that are missing storm surge data from 1880- present. The maps are provided by Unisys Corporation.
Note that the 1880s and 1890s were an active time in the region. Of the 16 missing events, eight occurred before the year 1900. It is recommended to analyze data from 1900 to present in order to minimize missing events.
Note that the 1880s and 1890s were an active time in the region. Of the 16 missing events, eight occurred before the year 1900. It is recommended to analyze data from 1900 to present in order to minimize missing events.
September 2-13, 1882
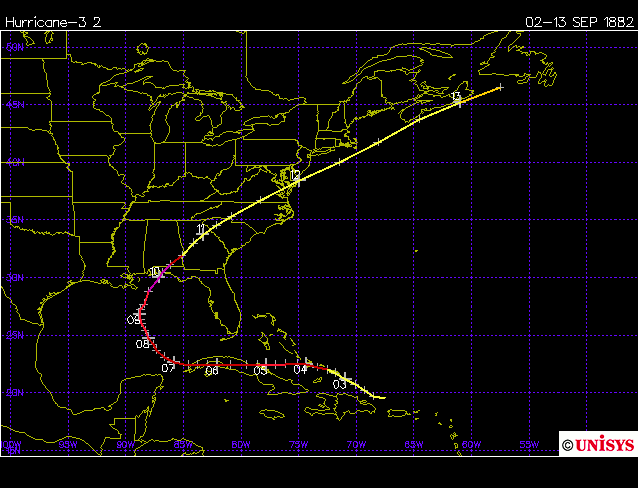
Source: Unisys Corporation
October 5-15, 1882
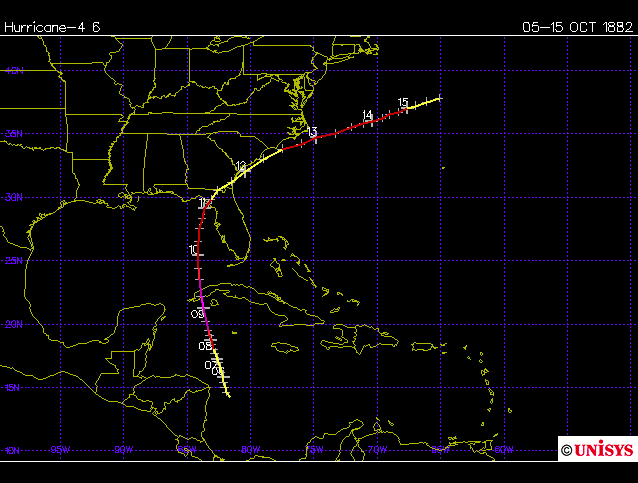
Source: Unisys Corporation
June 17-24, 1886
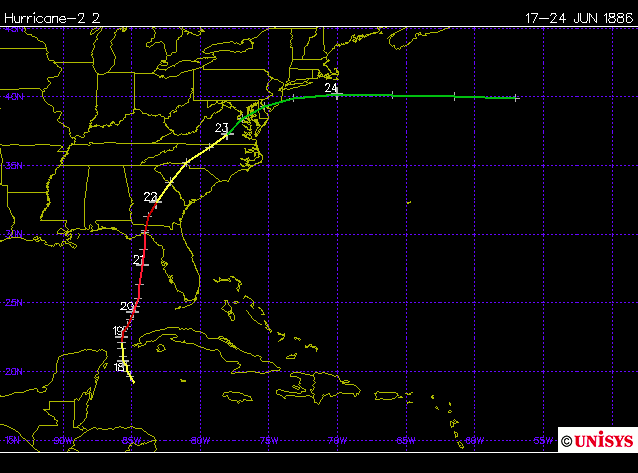
Source: Unisys Corporation
June 27 - July 2, 1886

Source: Unisys Corporation
July 20-28, 1887
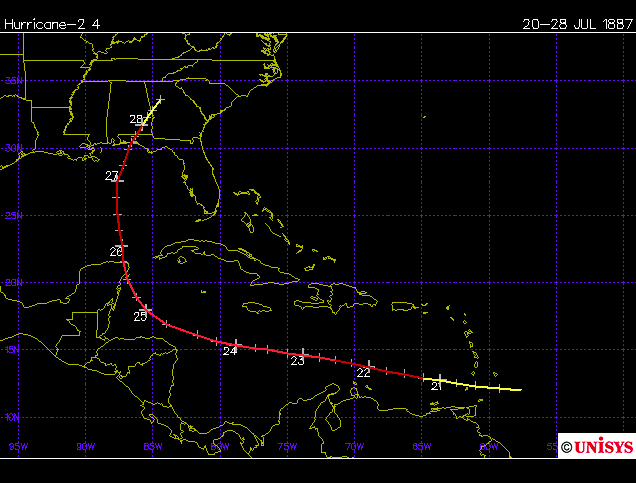
Source: Unisys Corporation
October 1-12, 1894

Source: Unisys Corporation
July 4-12, 1896
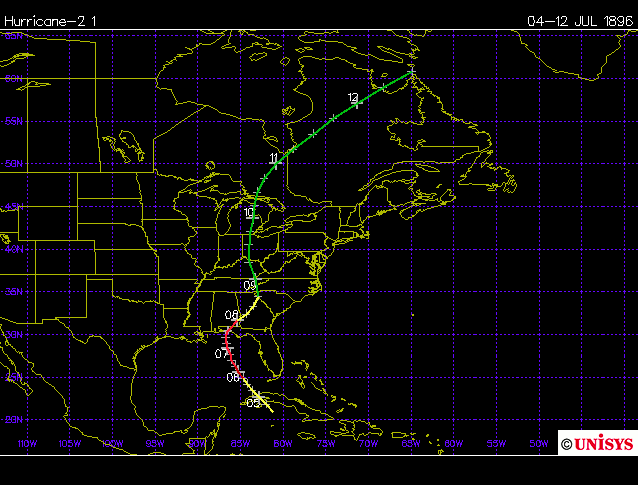
Source: Unisys Corporation
July 28 - August 2, 1899
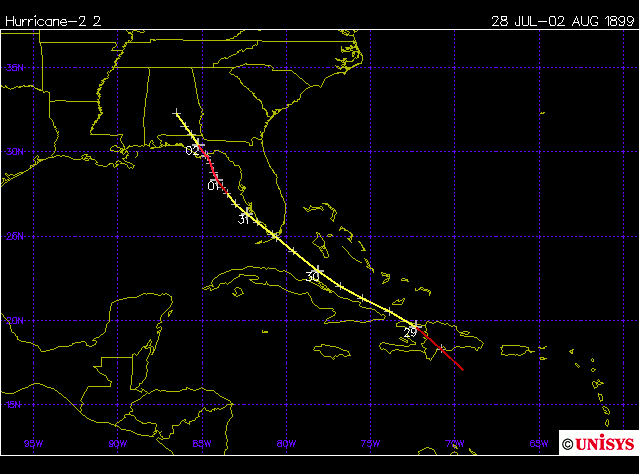
Source: Unisys Corporation
August 8-14, 1911
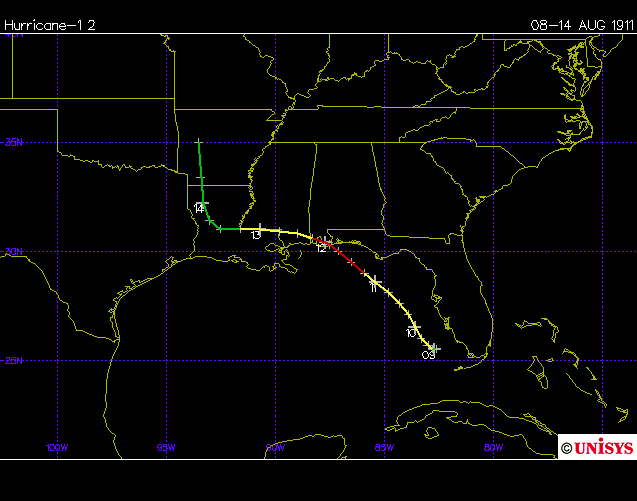
Source: Unisys Corporation
October 9-19, 1916
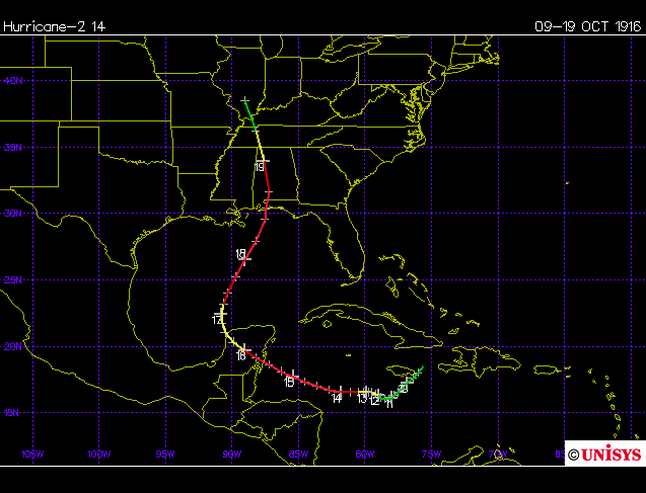
Source: Unisys Weather
September 20-30, 1917

Source: Unisys Corporation
June 28 - July 10, 1916
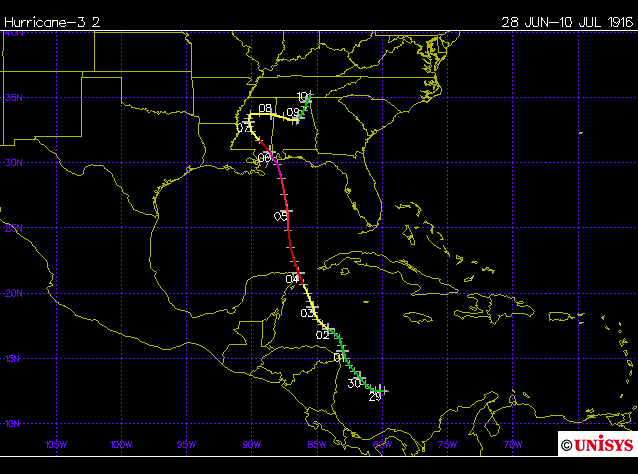
Source: Unisys Corporation
September 20-30, 1917
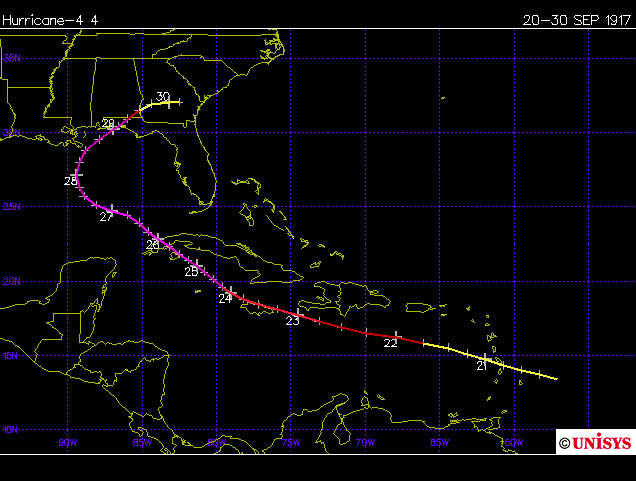
Source: Unisys Corporation
September 13-19, 1924
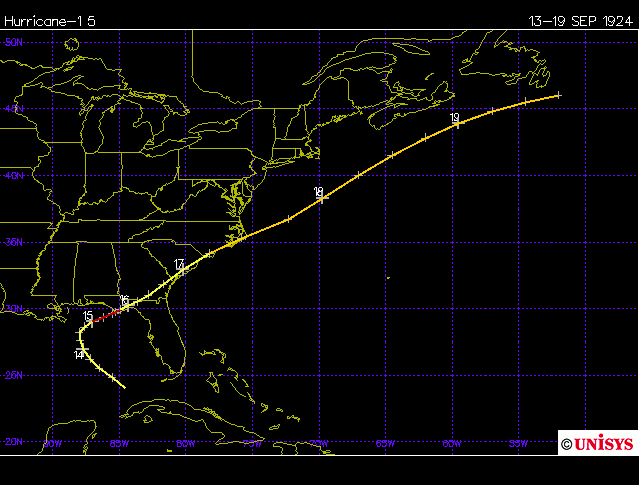
Source: Unisys Weather
September 19 - October 5, 1929
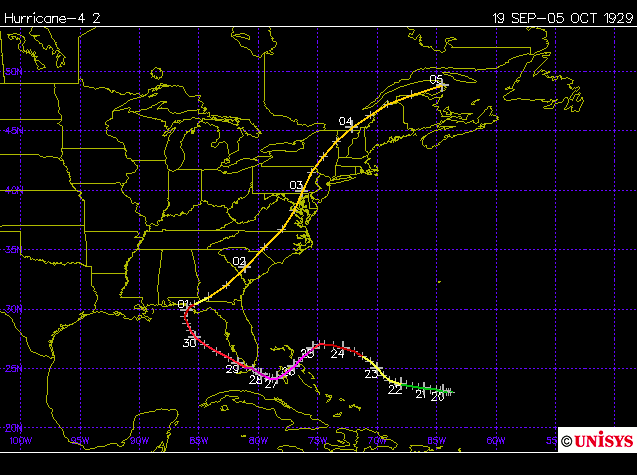
Source: Unisys Corporation
August 7-19, 1939
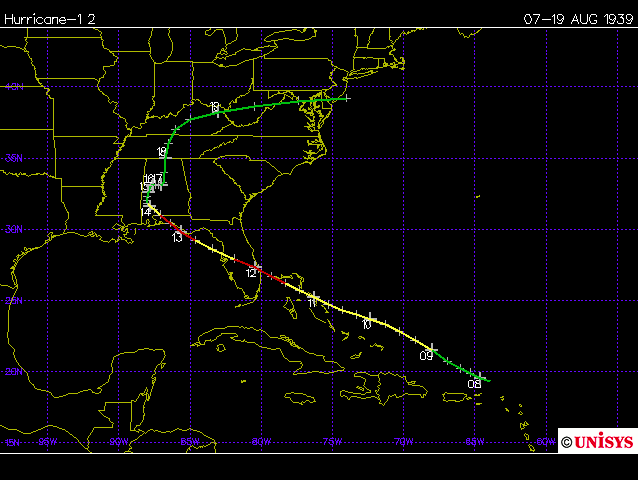
Source: Unisys Corporation
October 3-13, 1941
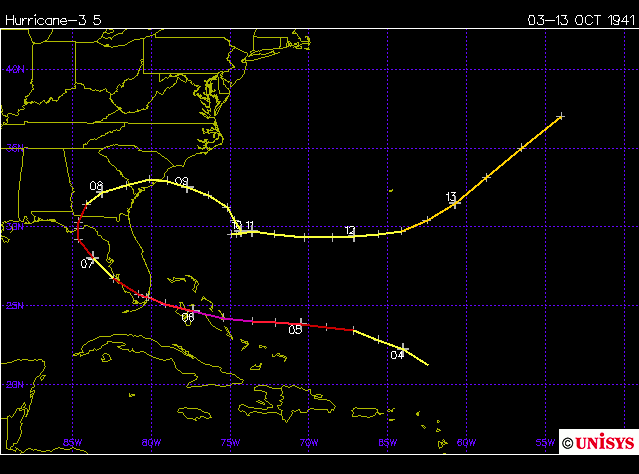
Source: Unisys Corporation
Hurricane Frederic
August 29 - September 15, 1979
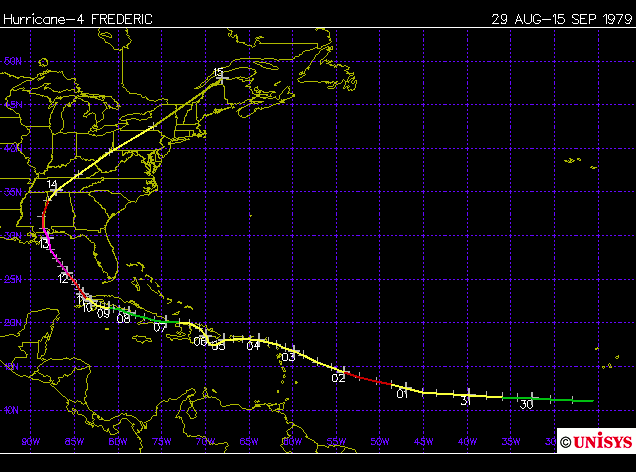
Source: Unisys Corporation
Local Experts
The following contacts have expertise related to storm surge flooding near Apalachicola:
1. Denise Imbler
Apalachee Regional Planning Council
[email protected]
1. Denise Imbler
Apalachee Regional Planning Council
[email protected]
Resources

Apalachee Regional Planning Council
Statewide Regional Evacuation Study Program
Link: http://thearpc.com/what-we-do/emergency-planning/regional-evacuation-study/
Multi-Media
Hurricane Dennis (2005)
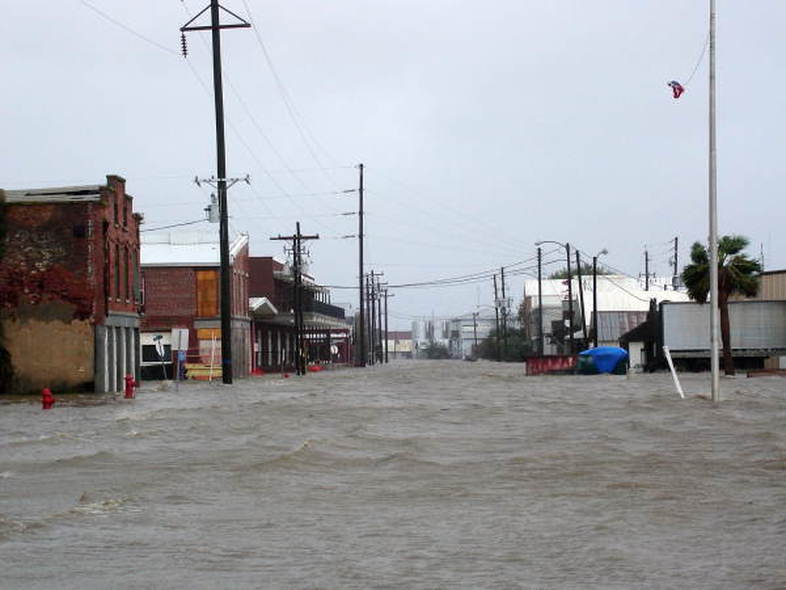
Flooding of Apalachicola streets from Hurricane Dennis [original source...click photo]
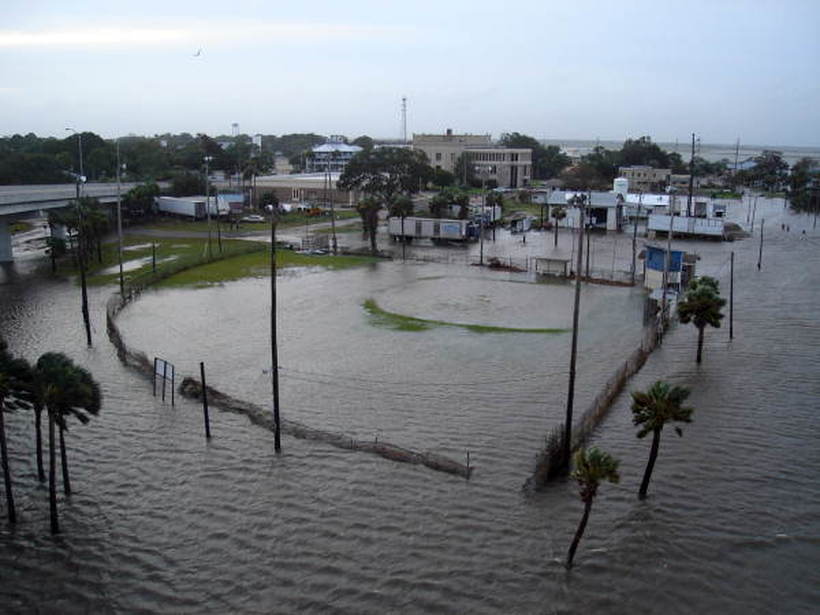
Battery Park baseball field in Apalachicola flooded during Hurricane Dennis [Original Source- Click Photo]
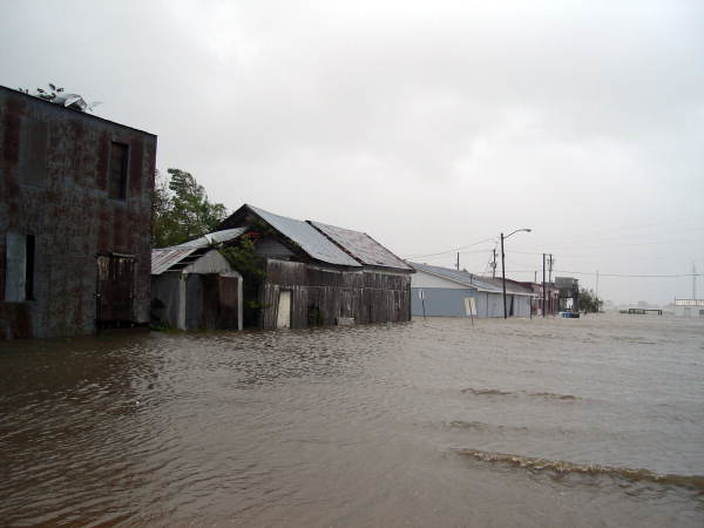
Streets flooded in Apalachicola during Hurricane Dennis [Original Source - Click Photo]
Hurricane Elena (1985)
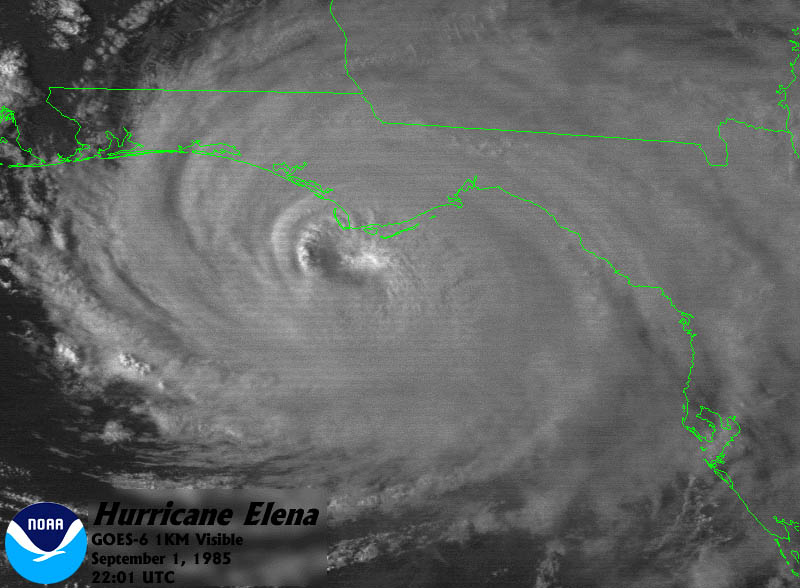
Visible satellite image of Hurricane Elena in 1985. Source: NOAA