South Padre Island
|
|
Infographics
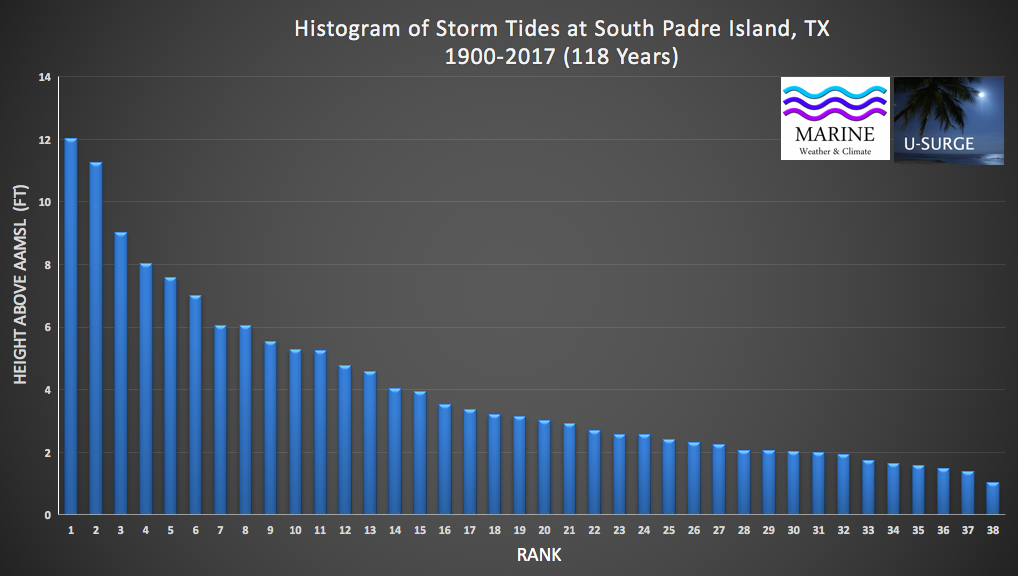
This histogram provides the maximum water levels of the 38 recorded storm tide events at South Padre Island since 1900. The events are ordered from the highest water level (Rank = 1) to lowest (Rank = 38). These events are not placed in chronological order. All data are detrended to remove the influence of relative sea level rise, so they represent water levels above an Annually-Adjusted Mean Sea Level (AAMSL).
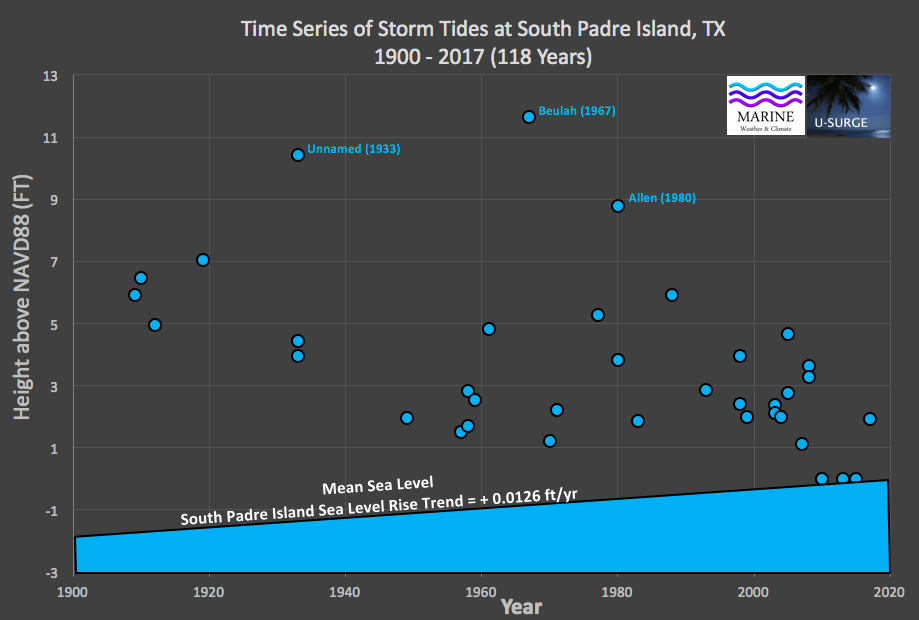
Time series provides of maximum water levels from 38 recorded storm tide events at South Padre Island since 1900. These events are ordered chronologically from oldest (left) to newest (right). The numerous low-magnitude events in recent decades are influenced by both climate and data availability. All data are converted to NAVD88 datum, however, the data are intentionally not detrended, so the influence of relative sea level rise is included. SLR trend taken from NOAA tide gauge at Port Isabel.
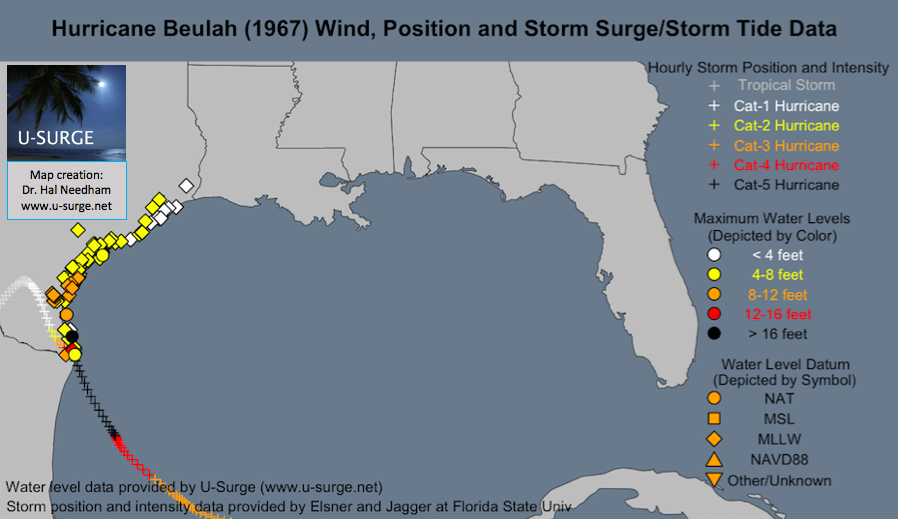
Hurricane Beulah (1967) generated a 12 ft (3.88m) storm tide above MSL, which is the highest recorded water level at S Padre Island/ Port Isabel. Farther north, Beulah generated an 18-ft storm surge near the S Padre Island/ Deer Island Boundary.
Statistics/ Return Period
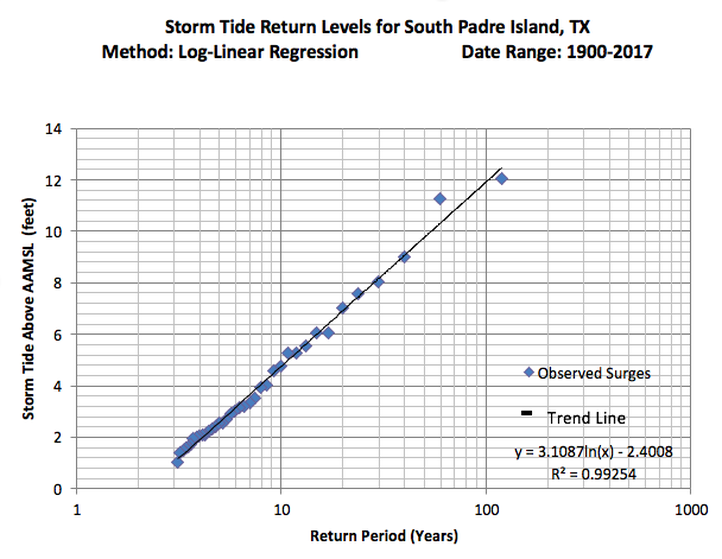
Storm tide return levels graph for South Padre Island. This graph uses a log-linear regression plot based on observed data from 1900-2017 (118 years). These data have been detrended to remove the influence of relative sea level rise. Water levels are plotted above Annually-Adjusted Mean Sea Level (AAMSL).
Return Period |
Storm Tide Level (feet above AAMSL) |
500-year |
16.91 |
200-year |
14.08 |
100-year |
11.93 |
50-year |
9.76 |
25-year |
7.61 |
10-year |
4.75 |
Extreme water levels above Annually-Adjusted Mean Sea Level (AAMSL) with long-term sea level rise removed. The correct way to interpret these levels is as follows: Based on a log-linear regression of observed data from 1900-2017, storm tide levels for South Padre Island should equal or exceed 11.93 ft every 100 years, on average, above the annually-adjusted MSL. According to the regression equation, Hurricane Beulah's (1967) storm tide, which reached 12.04 ft above AAMSL (when detrended for sea-level rise), was a 105-year event. This was the highest observed water level on record.
Sea Level Rise and Future Extreme Water Levels
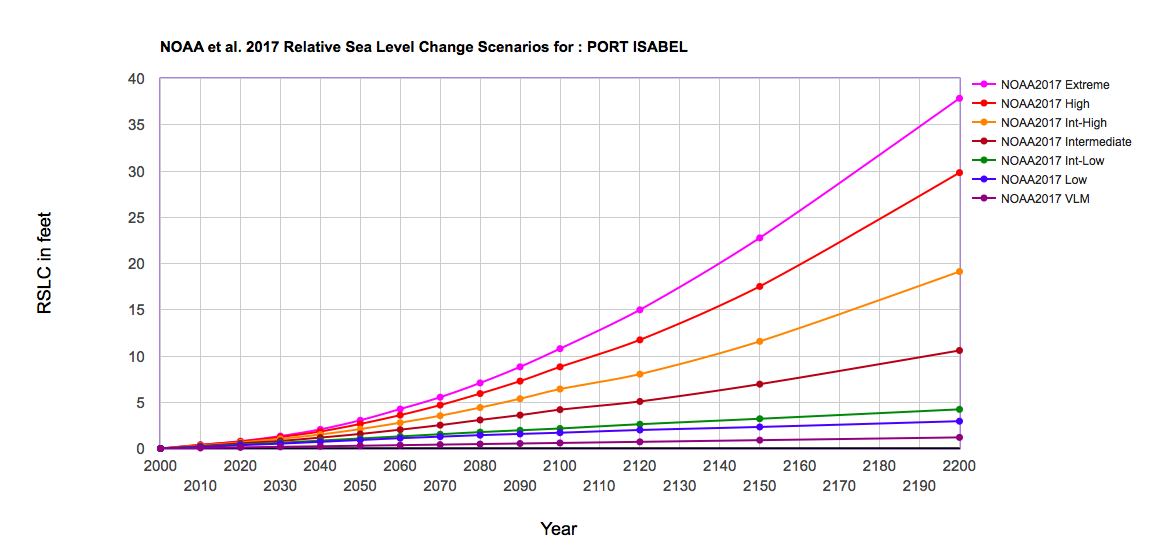
Graph of SLR scenarios for Port Isabel, Texas, from NOAA et al. (2017). The CorpsClimate web-tool developed by U.S. Army Corps of Engineers provided this graph. Data revised July 18, 2017. Available on the Web at: http://corpsclimate.us/ccaceslcurves.cfm.
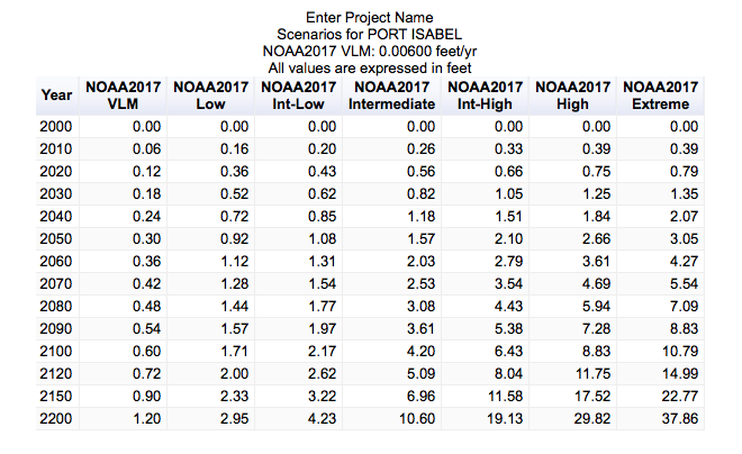
Table of SLR scenarios for Port Isabel, Texas, from CorpsClimate web-tool developed by U.S. Army Corps of Engineers. Data from this table revised July 18, 2017. Available on the Web at: http://corpsclimate.us/ccaceslcurves.cfm.
Year |
100-Year Flood Intermediate SLR |
100-Year Flood Intermediate-High SLR |
2000 |
11.99 |
11.99 |
2020 |
12.55 |
12.65 |
2040 |
13.17 |
13.50 |
2060 |
14.02 |
14.78 |
2080 |
15.07 |
16.42 |
2100 |
16.19 |
18.42 |
This table provides future 100-year water levels above NAVD88. These numbers are calculated by adding four values: 1) The 100-year storm tide listed in the Statistics/ Return Period section- measured in feet above AAMSL; 2) An adjustment from MSL to NAVD88, which involved subtracting 0.04 ft from all water levels; 3) A conversion from water levels in 1992 (the mean year of the Present Epoch) to 2000, based on a long-term SLR rate of 1.29 ft/ century, or 0.10 feet from 1992 to 2000; 4) Sea-level rise projections from NOAA (2017), shown in the Future SLR Graph and Table above.
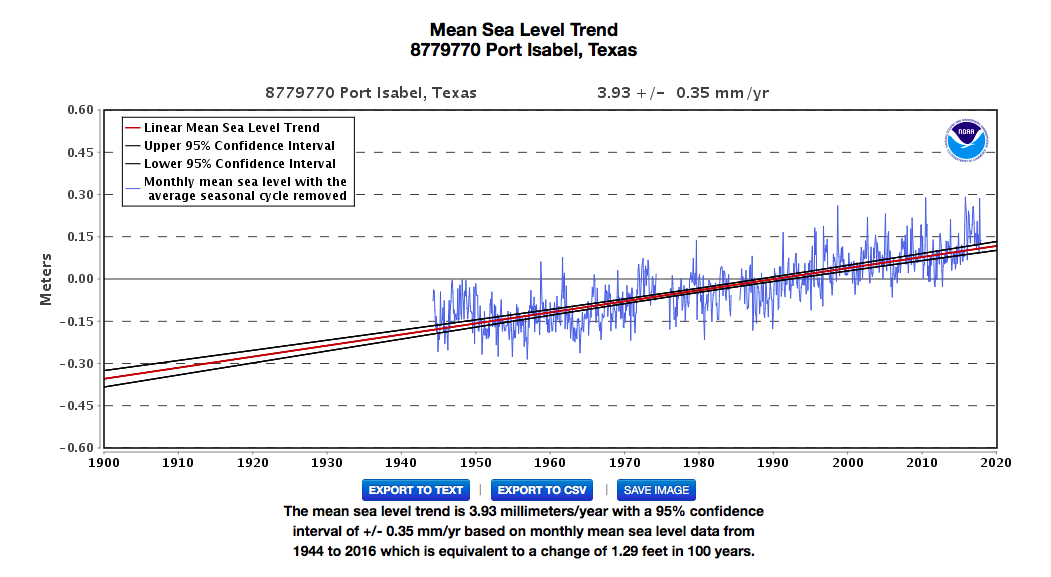
Long-term SLR graph for Port Isabel, Texas. The long-term rate of SLR is 1.29 feet/century.
Source: https://tidesandcurrents.noaa.gov/sltrends/sltrends_station.shtml?stnid=8779770.
Source: https://tidesandcurrents.noaa.gov/sltrends/sltrends_station.shtml?stnid=8779770.
Data Sources
Tide Gauge Data from NOAA Tides and CurrentS
|
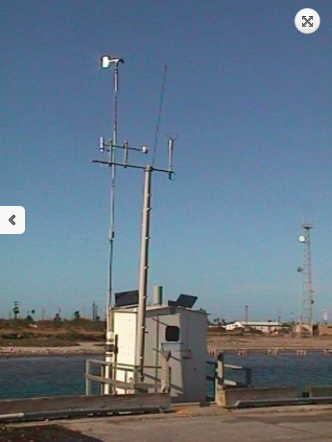
Tide Gauge Site #1: Port Isabel Tide Gauge
Operation: National Ocean Service (NOS) Coordinates: Lat: 26.0617, Lon: -97.215 Dataset 6-min Water Level Data Jan 1, 1996 - Nov 30, 2015 Hourly Water Level Data Jan 26, 1977 - Jun 6, 1984 Jun 12, 1985 - Nov 30, 2015 |
|
The NOS tide gauge at Port Isabel provides verified hourly data since 1977 and verified 6-min data since 1996.
Tide Gauge from U.S. Coast Guard
|
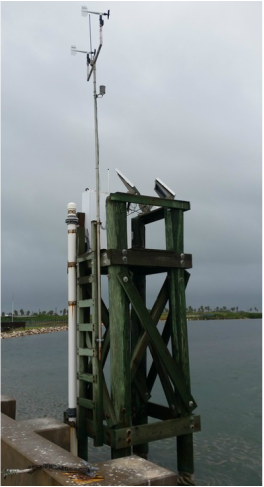
Tide Gauge Site #2: South Padre Island Coast Guard Station
Operation: TCOON Coordinates: Lat: 26.0767, Lon: -97.1767 Dataset 6-min Water Level Data Apr 7, 2004 - Oct 13, 2007 Aug 22, 2008 - Oct 13, 2014 Sep 22, 2015 - present |
|
The South Padre Island Coast Guard (TCOON) Tide Gauge
ADDITIONAL SOURCES
Other Scientific Sources
See Needham and Keim (2012) for other scientific sources used to build South Padre Island storm surge data.
Anecdotal Sources
See Needham and Keim (2012) for anecdotal sources, such as newspaper archives, that were helpful for building Apalachicola storm surge data.
See Needham and Keim (2012) for other scientific sources used to build South Padre Island storm surge data.
Anecdotal Sources
See Needham and Keim (2012) for anecdotal sources, such as newspaper archives, that were helpful for building Apalachicola storm surge data.
DATA-SELECTION CIRCLE
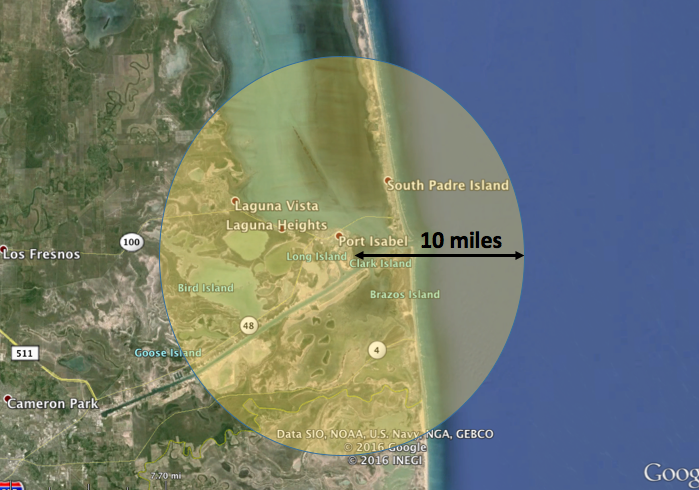
South Padre Island storm tide data were taken from a data-selection circle with a 10-mile radius, shown on the map above.
Missing Data
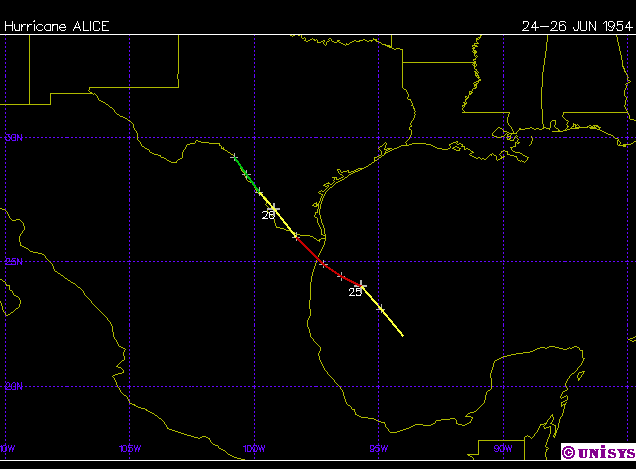
We have identified eight hurricanes/ tropical storms that may have generated storm surges exceeding 4 ft (1.22 m) near South Padre Island/ Port Isabel between 1900- present, but a literature review does not yet provide data. The maps are provided by Unisys Corporation.
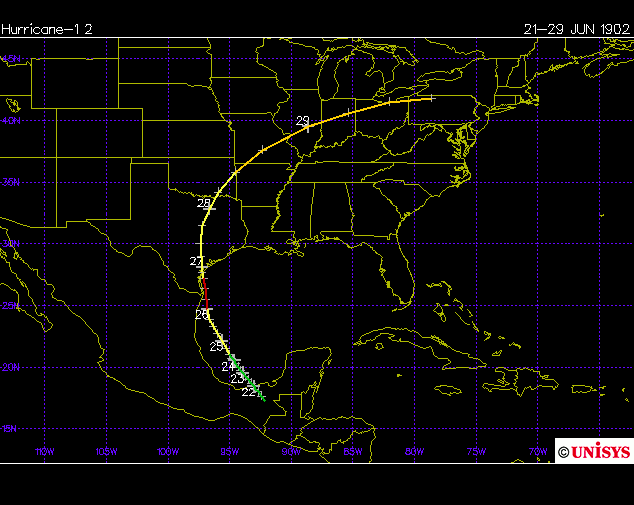
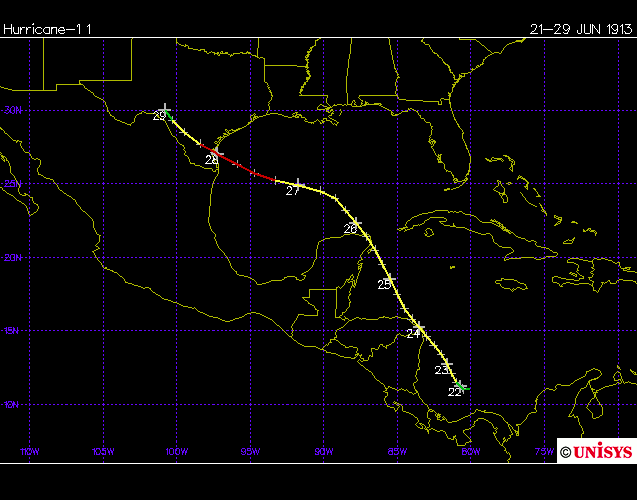
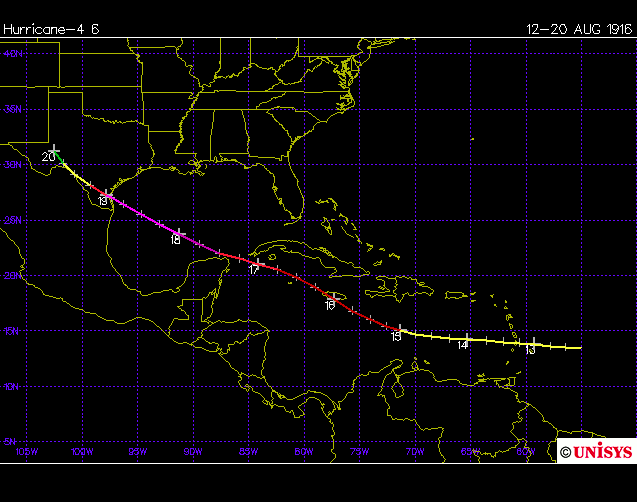
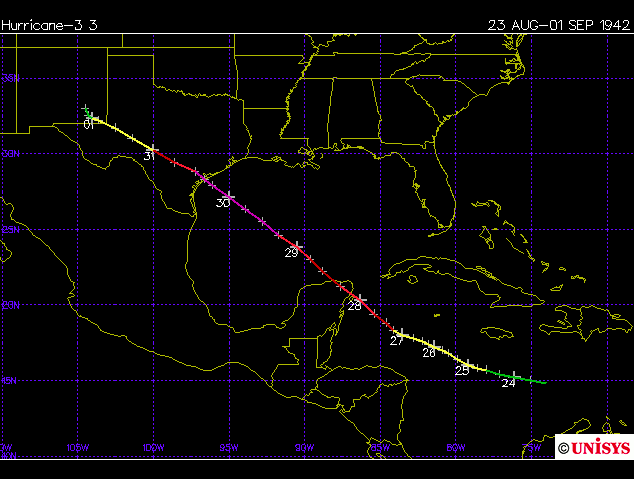
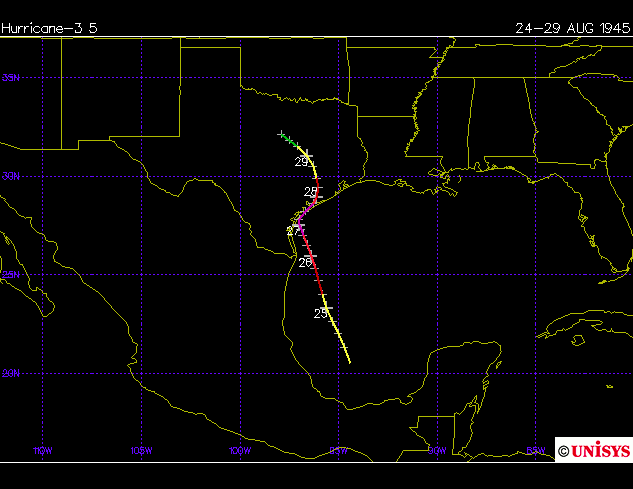
June 24-26, 1954
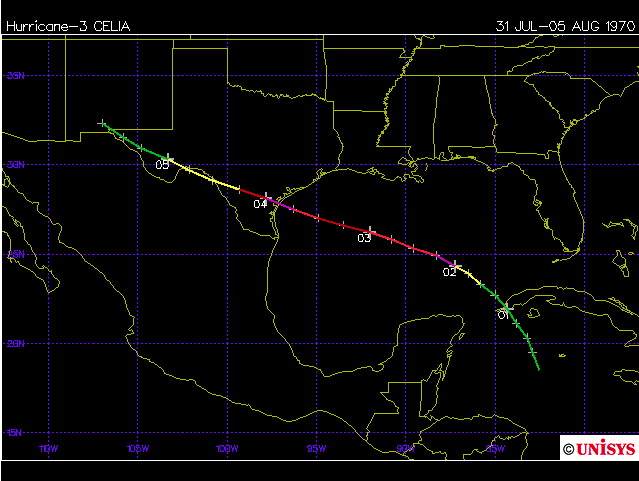
Hurricane Celia
July 31 - August 5, 1970
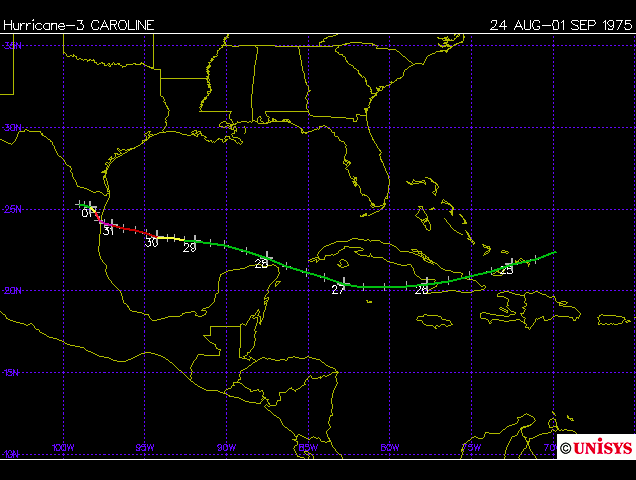
August 24 - September 1, 1975
Local Partnership
This analysis and website is possible thanks to funding provided by the City of South Padre Island.
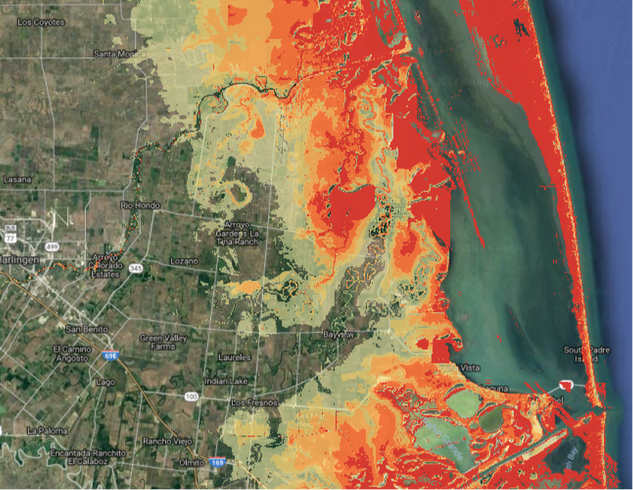
The U-Surge project has developed geospatial products for the City of South Padre Island. These products provide high-resolution interactive maps that communicate flood risk both now and in the future. The image above provides a snapshot of local flood risk from a zoomed-out map.
Storm Surge Multimedia
Note: Each of these pics/ videos were taken at South Padre Island/ Port Isabel
Hurricane Isaac (2012) produced substantial waves but minimal storm surge at South Padre Island. We posted this video because: 1) It shows the power of hurricanes to displace water across great distances; 2) People were surfing/ having fun in a responsible way...on waves outside the main impact zone (we do not post videos of people in waves near the impact zone); and 3) Many of us involved in this research have coastal interests and love to surf!
This video provides some nice storm surge footage. Easy to see in beginning, but look closely through storm door in middle of video and you can see waves hitting the building where video was taken. Click video for source.
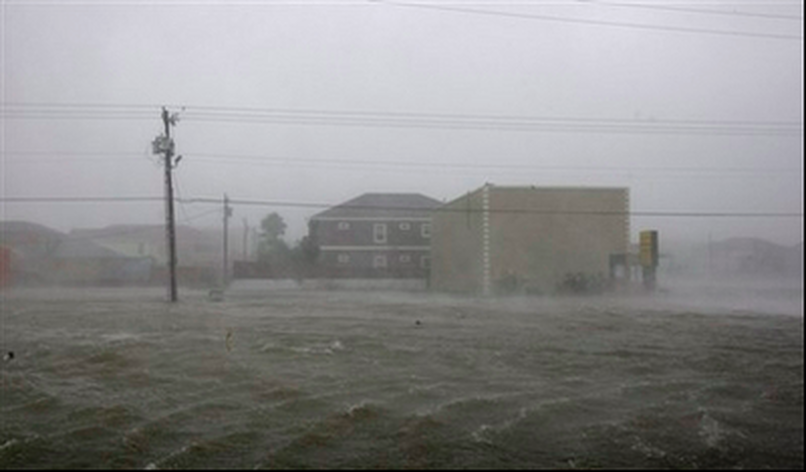
Water covers Padre Boulevard as Hurricane Dolly makes landfall on South Padre Island, Texas on Wednesday, July 23, 2008.
(AP Photo/San Antonio, Express-News, Jerry Lara). Click photo for link to source.
(AP Photo/San Antonio, Express-News, Jerry Lara). Click photo for link to source.
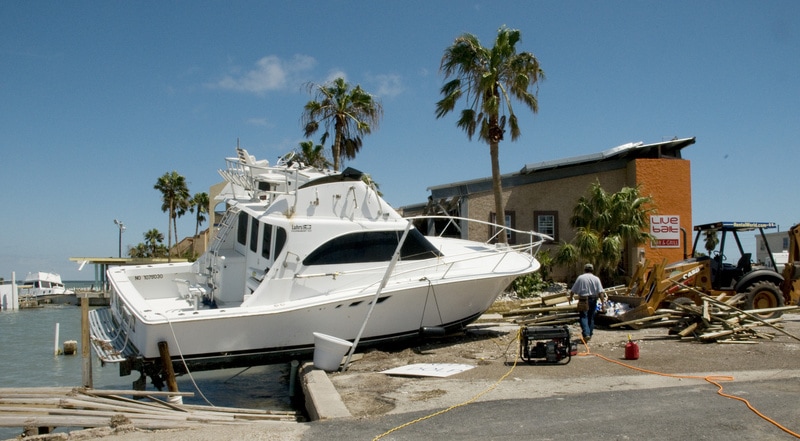
Storm surge elevated this boat onto land at South Padre Island during Hurricane Dolly. Photographer: FEMA/ Patsy Lynch. Photo Date: July 28, 2008. Link: http://www.city-data.com/disaster-photos/37375.html
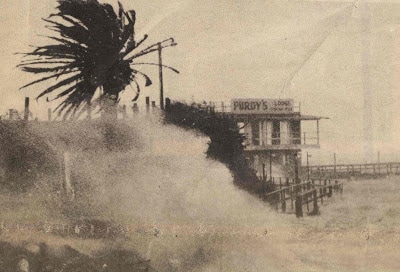
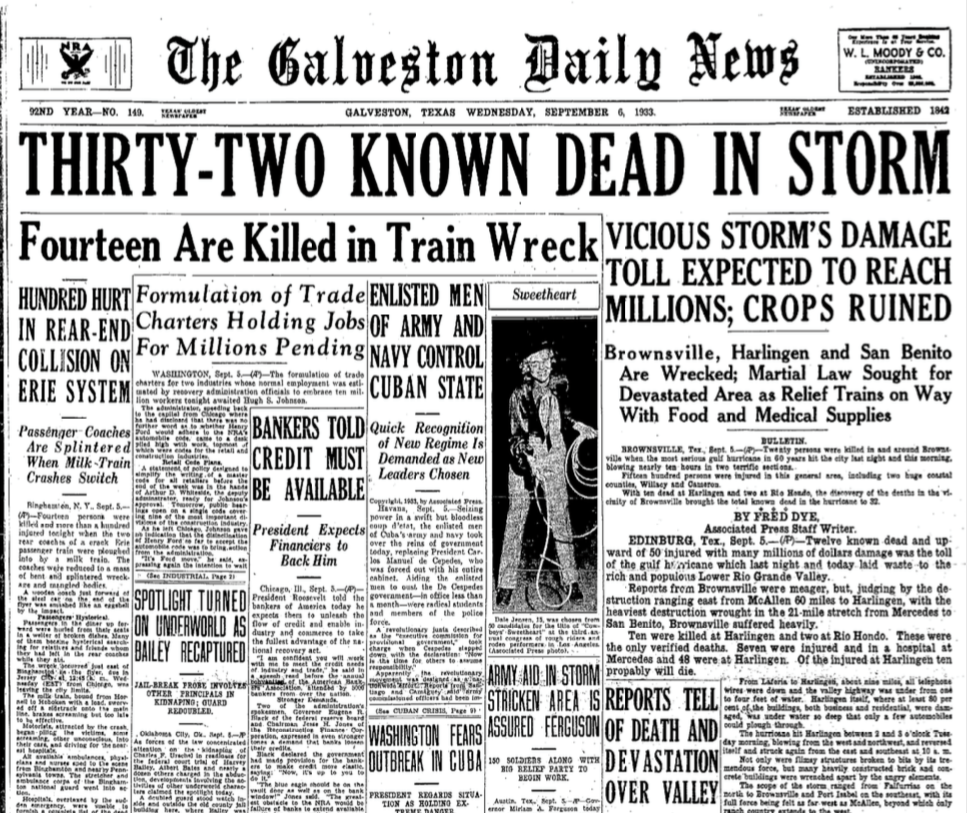
Galveston Daily News, September 6, 1933, Page 1
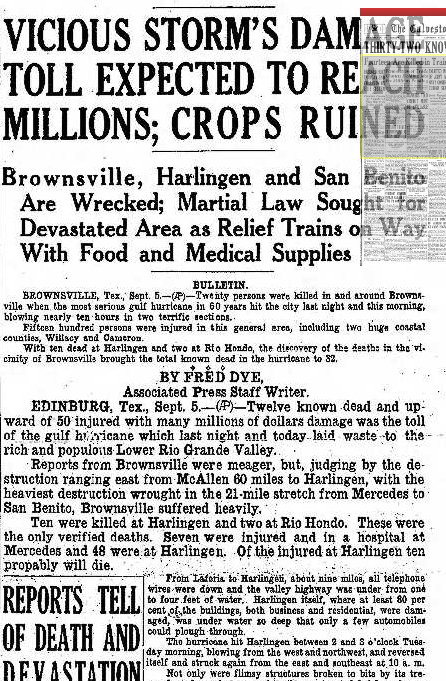
Galveston Daily News, September 6, 1933, Page 1