Providence

|
|
Infographics
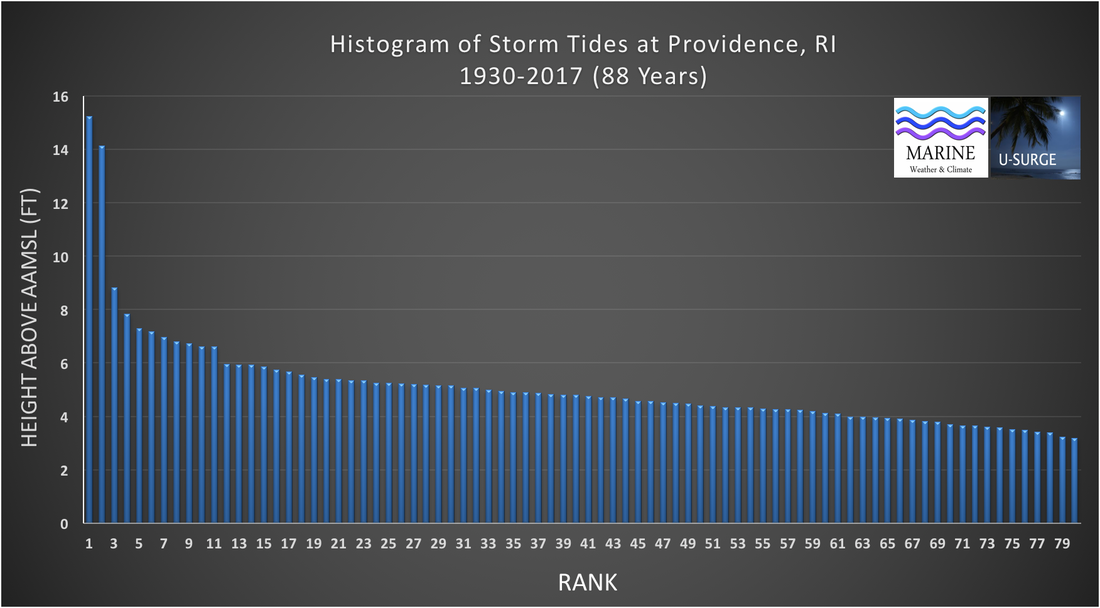
This histogram provides the maximum water levels of the 79 storm tide events at Providence, RI since 1930. The events are ordered from the highest water level (Rank=1) to lowest (Rank=79). These events are not placed in chronological order. All data are detrended to remove the influence of relative sea level rise, so they represent water levels above an Annually-Adjusted Mean Sea Level (AAMSL).
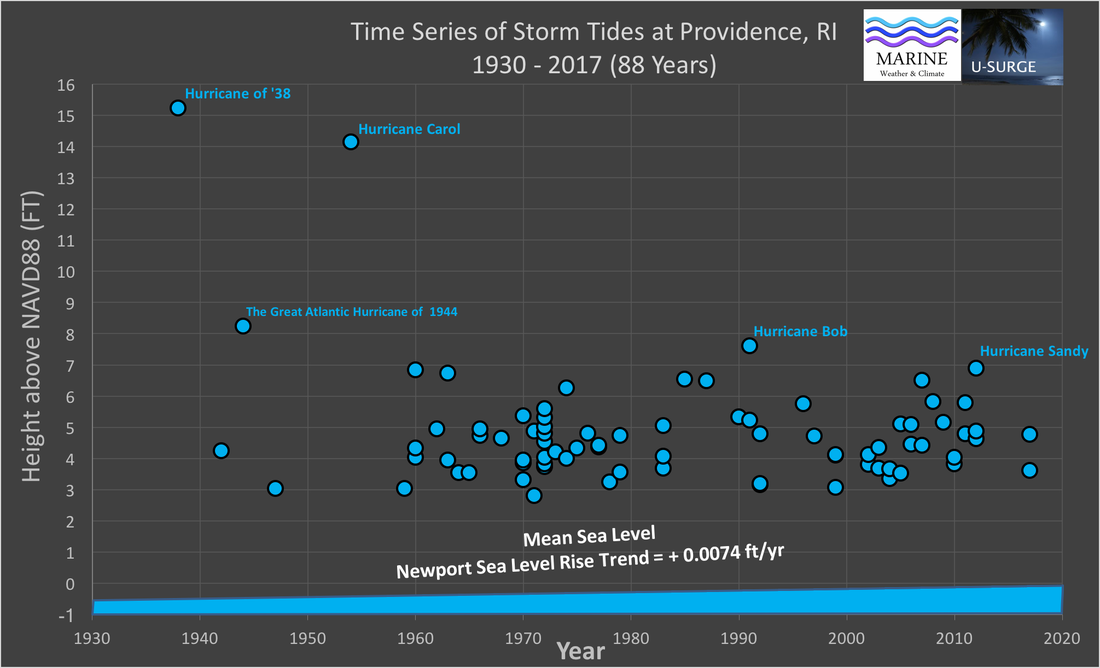
This time series provides maximum water levels from 79 recorded storm tide events at Providence, RI since 1930. These events are ordered chronologically from oldest (left) to newest (right). The numerous low-magnitude events in recent decades are influenced by both climate and data availability. All data are converted to NAVD88 datum, however, the data are intentionally not detrended, so the influence of relative sea level rise (SLR) is included. SLR trend taken from NOAA tide gauge at Providence.
Statistics/ Return Period
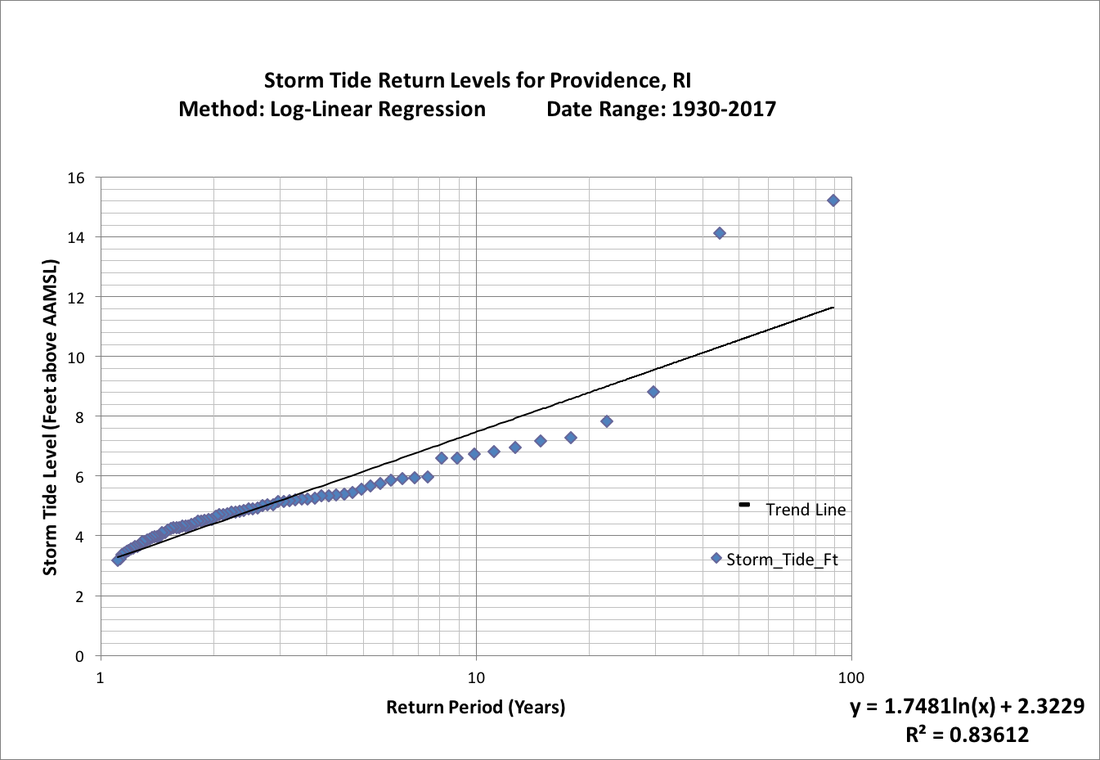
Storm tide return levels graph for Providence, RI. This graph uses a log-linear regression plot based on observed data from 1930-2017 (88 years). This analysis is conducted on the 79 storm tide events that are greater than or equal to 3.0 feet above the Annually-Adjusted Mean Sea Level (AAMSL). These data have been detrended to remove the influence of sea level rise.
Return Period |
Storm Tide Level ft above (AAMSL) |
500-yr |
13.19 |
200-yr |
11.58 |
100-yr |
10.38 |
50-yr |
9.16 |
25-yr |
7.95 |
10-yr |
6.35 |
Extreme water levels above Annually-Adjusted Mean Sea Level (AAMSL) with long-term sea level rise removed. The correct way to interpret these levels is as follows: Based on a log-linear regression of observed data from 1930-2017, storm tide levels at Providence should equal or exceed 10.38 ft every 100 years, on average, above the annually-adjusted MSL.
Sea-Level Rise and Future Extreme Water Levels
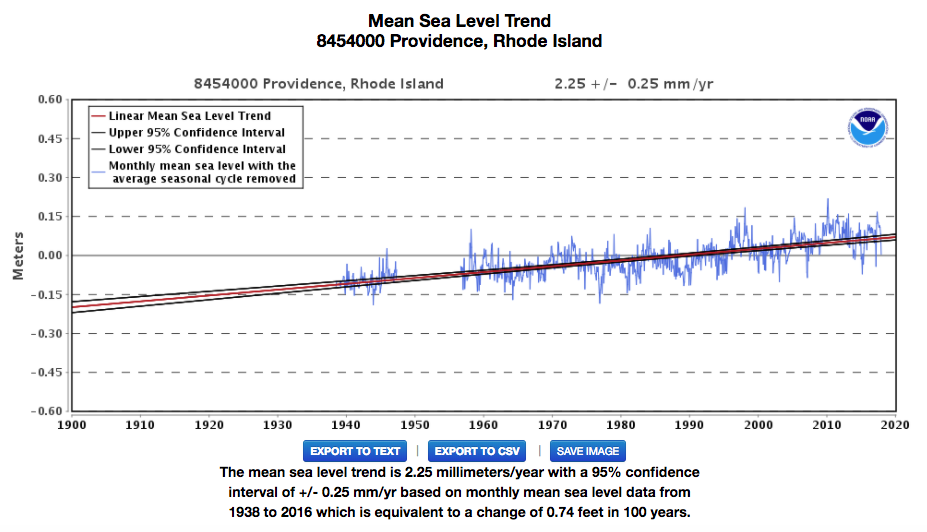
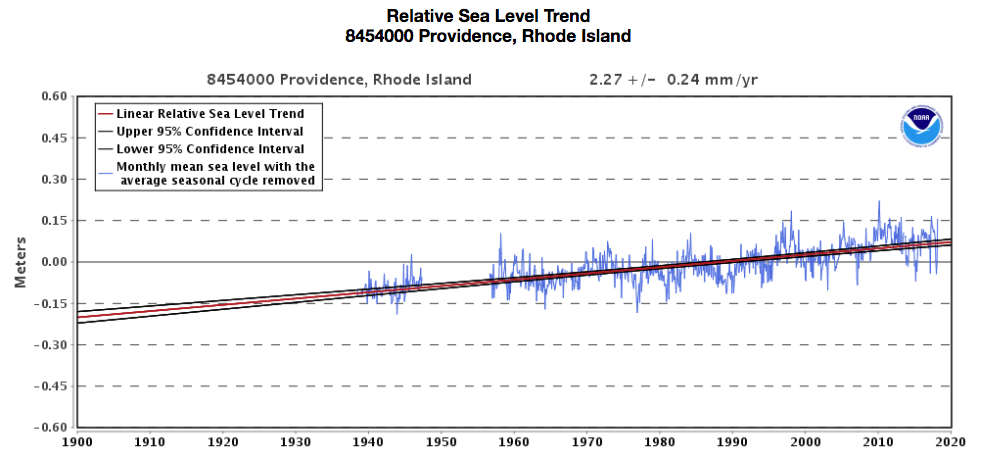
Long-term SLR graph for Providence, Rhode Island. The long-term rate of SLR is 0.74 feet/century.
Source: https://tidesandcurrents.noaa.gov/sltrends/sltrends_station.shtml?stnid=8779770.
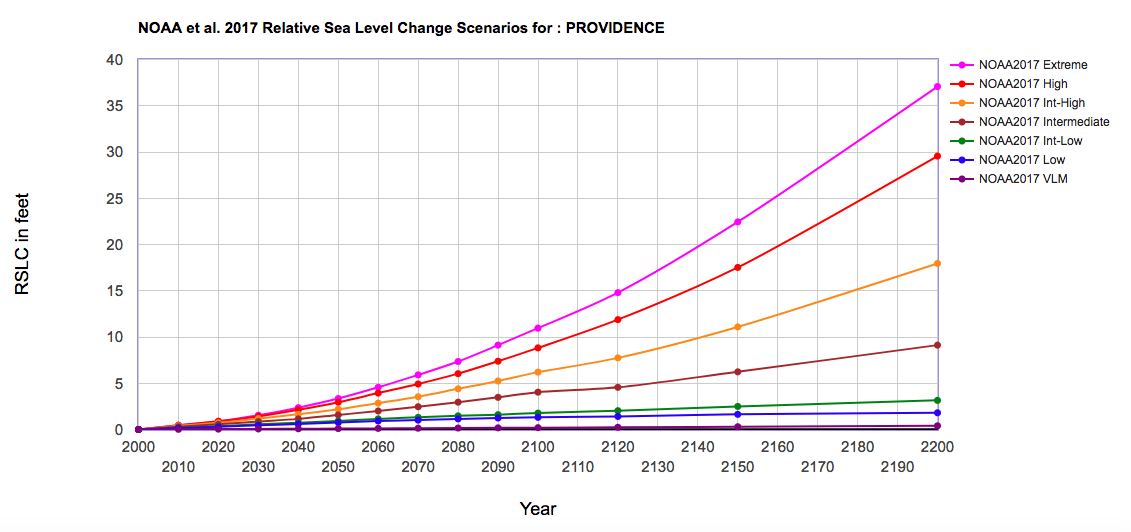
Graph of SLR scenarios for Providence, Rhode Island, from NOAA et al. (2017). The CorpsClimate web-tool developed by U.S. Army Corps of Engineers provided this graph. Data revised July 18, 2017. Available on the Web at: http://corpsclimate.us/ccaceslcurves.cfm.
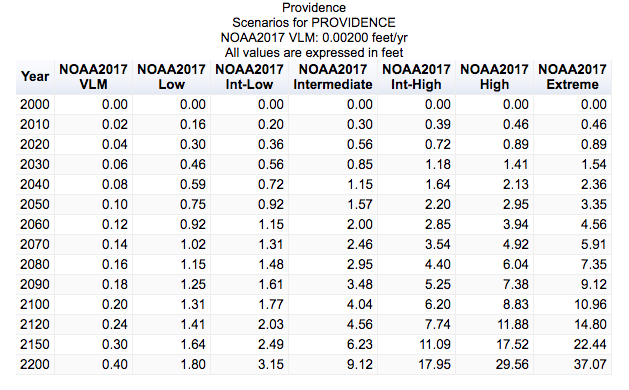
Table of SLR scenarios for Providence, Rhode Island, from CorpsClimate web-tool developed by U.S. Army Corps of Engineers. Data from this table revised July 18, 2017. Available on the Web at: http://corpsclimate.us/ccaceslcurves.cfm.
Year |
Intermediate SLR |
Intermediate-High SLR |
2000 |
10.21 |
10.21 |
2020 |
10.78 |
10.94 |
2040 |
11.37 |
11.85 |
2060 |
12.22 |
13.07 |
2080 |
13.17 |
14.62 |
2100 |
14.26 |
16.42 |
This table provides future 100-year water levels above NAVD88 for Providence, RI. These numbers are calculated by adding three values: 1) The 100-year storm tide listed in the Statistics/ Return Period section 2) Projected SLR from the Future Table in the Sea Level Rise section 3) An adjustment in water level above NAVD88 between the year 2000 and the mean year of the Current Epoch for datum analysis. For Newport, Rhode Island, that mean year is 1992 and the water level adjustment is 0.074 feet, based on a long-term SLR rate of 2.27 cm/yr shown in Past Graph in the Sea Level Rise section.
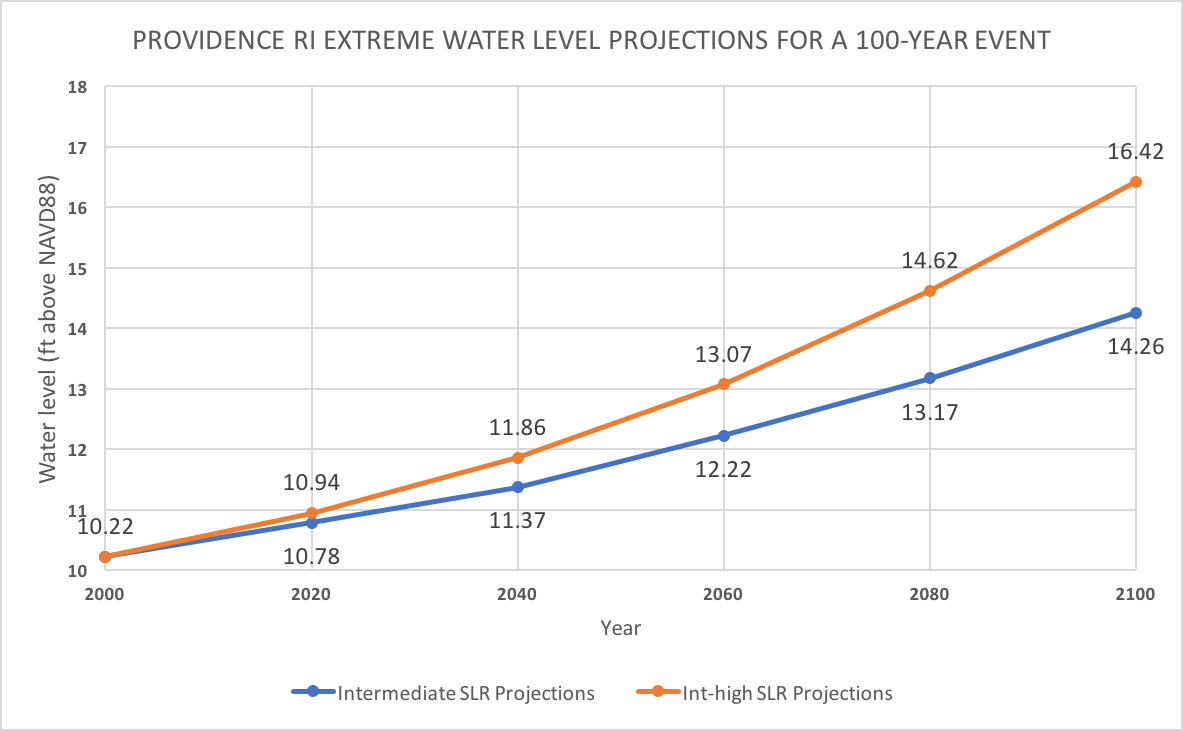
This graph is a visual representation of the changing water levels associated with a Providence 100-year storm, including the effects of sea levels rise. This provides future 100-year water levels above NAVD88. These numbers are calculated by adding three values: 1) The 100-year storm tide listed in the Statistics/ Return Period section 2) Projected SLR from the Future Table in the Sea Level Rise section 3) An adjustment in water level above NAVD88 between the year 2000 and the mean year of the Current Epoch for datum analysis. For Newport, Rhode Island, that mean year is 1992 and the water level adjustment is 0.072 feet, based on a long-term SLR rate of 2.27 cm/yr shown in Past Graph in the Sea Level Rise section.
Storm Surge Data Sources
|
Tide Gauge Site: Providence, RI 8454000
Operation: National Ocean Service (NOS) Coordinates: Lat: 41.8067, Lon: -71.4 6-min Water Level Data Jan 1, 1996 - Dec 31, 2017 Hourly Water Level Data Jun 03, 1938 - Jun 23, 1947 Sep 01, 1956 - Apr 30, 1967 Nov 01, 1967 - Dec 31, 2017 |
|
The NOS tide gauge at Providence provides verified hourly data since 1938 and verified 6-min data since 1996.
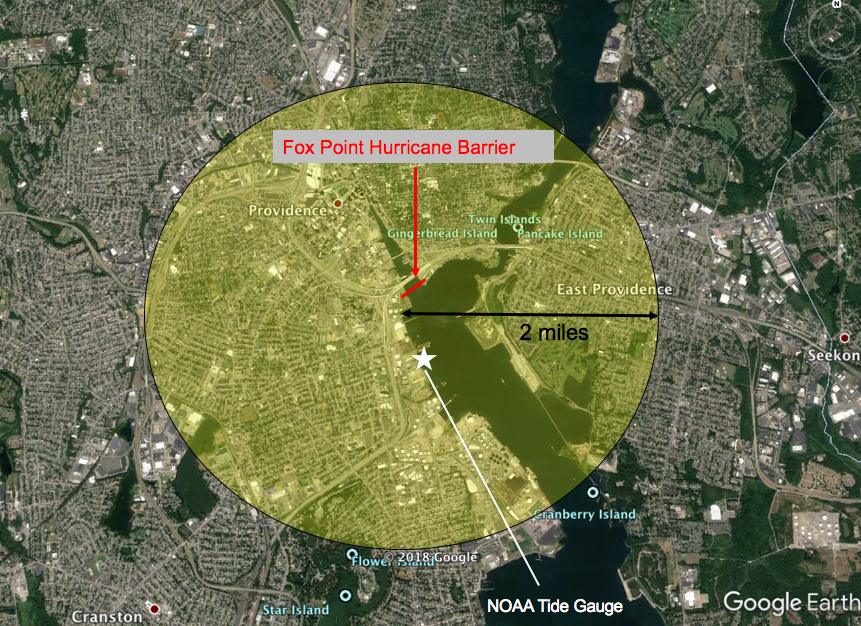
Providence storm surge data were taken from a data-selection circle with a two-mile radius centered on Lat 41.8067, Lon -71.4000. This area covers downtown Providence, portions of the Seekonk River and Providence River. It also contains a NOAA tide gauge, which started recording data in 1938. The Fox Point Hurricane Barrier has been closed during Hurricane Gloria (1985) and Hurricane Bob (1991), but is located upriver from the NOAA tide gauge. As the barrier protects a relatively small, yet important section of the metro area, additional water buildup outside the barrier is negligible and should not significantly increase water levels at the NOAA tide gauge.
Missing Data
|
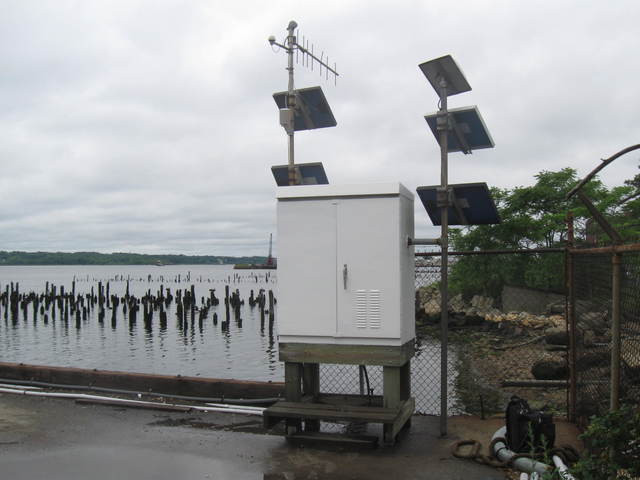
Missing Tide Gauge Data:
These are data that may have been missed after the NOAA tide gauges installment due to tide gauge blackouts. These gauges can go offline for extended periods of time due to damage or maintenance. (Photo source: NOAA.gov) |
|
Storm Surge Multimedia
Local Partnership
Providence U-Surge Team
Vanessa Anderson - Graduate Student, University of Rhode Island
Caroline Salvaneschi - Graduate Student, University of Rhode Island
Austin Becker, Ph.D. - Assistant Professor of Coastal Planning, Policy, and Design, University of Rhode Island
Hal Needham, Ph.D. - Founder and President, Marine Weather and Climate