Galveston
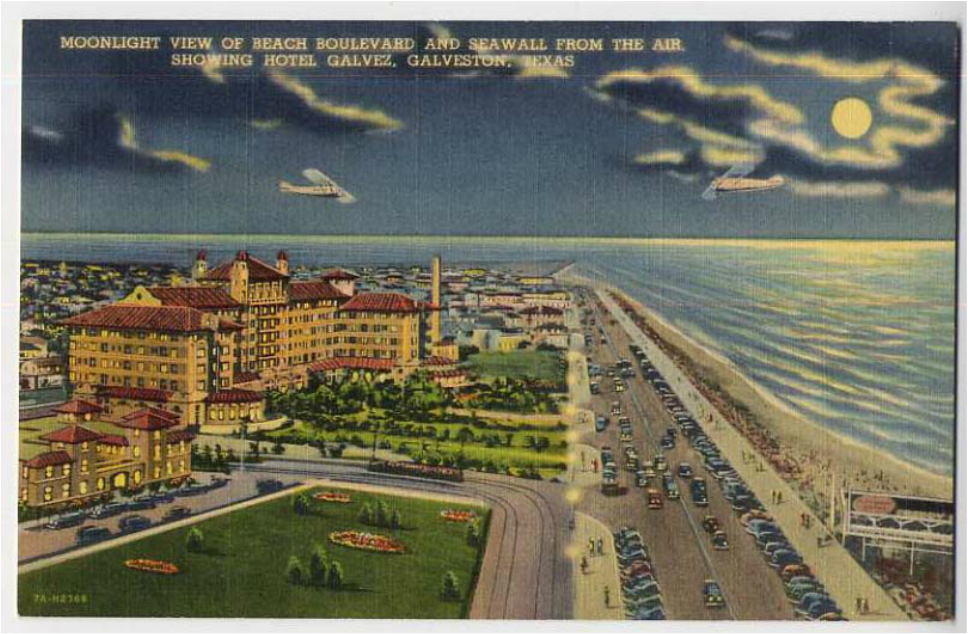
About GalvestonThe city of Galveston was established in 1839 and grew quickly as a prosperous port. By the end of the 19th Century, Galveston was one of the wealthiest cities per capita in the U.S. and contained 37,000 residents. Galveston was struck by a category-4 hurricane and massive storm surge on September 8, 1900. The storm killed approximately 6,000-8,000 people, making it the deadliest natural disaster in U.S. history. The city responded with fierce resiliency initiatives, such as a massive sea wall and a grade-raising project that elevated more than 500 city blocks. Galveston has reinvented itself as a hub for tourism, popular destination for retirement and a location where two universities, Univ of Texas Medical Branch (UTMB) and Texas A&M Galveston, conduct cutting-edge research.
|
Storm Surge HistoryU-Surge has more data for Galveston than any city in the world. The project has identified 85 high water marks from hurricanes and tropical storms since 1900. The 1900 Storm generated the highest-recorded storm tide, with water levels reaching 15.7 ft above Mean Low Tide. Five events have generated storm tides exceeding 10 ft, with hurricanes Carla (1961) and Ike (2008) both generating storm tides 11.12 ft above the estimated Mean Sea Level for their respective years. However, Ike's storm tide reached a water mark precisely one foot higher than Carla's because of rapid sea level rise in the area. Ike's total water level (including sea level rise) ranks #2 in recorded history, and is still fresh on the minds of Galvestonians.
|
Infographics
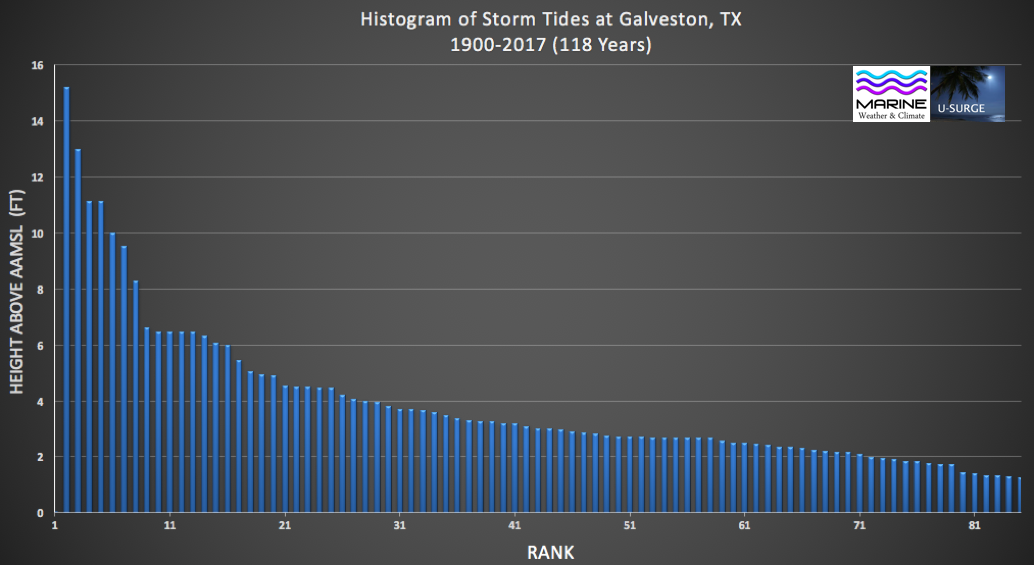
This histogram provides the maximum water levels of the 85 storm tide events at Galveston since 1900. The events are ordered from the highest water level (Rank=1) to lowest (Rank=85). These events are not placed in chronological order. All data are detrended to remove the influence of relative sea level rise, so they represent water levels above an Annually-Adjusted Mean Sea Level (AAMSL).
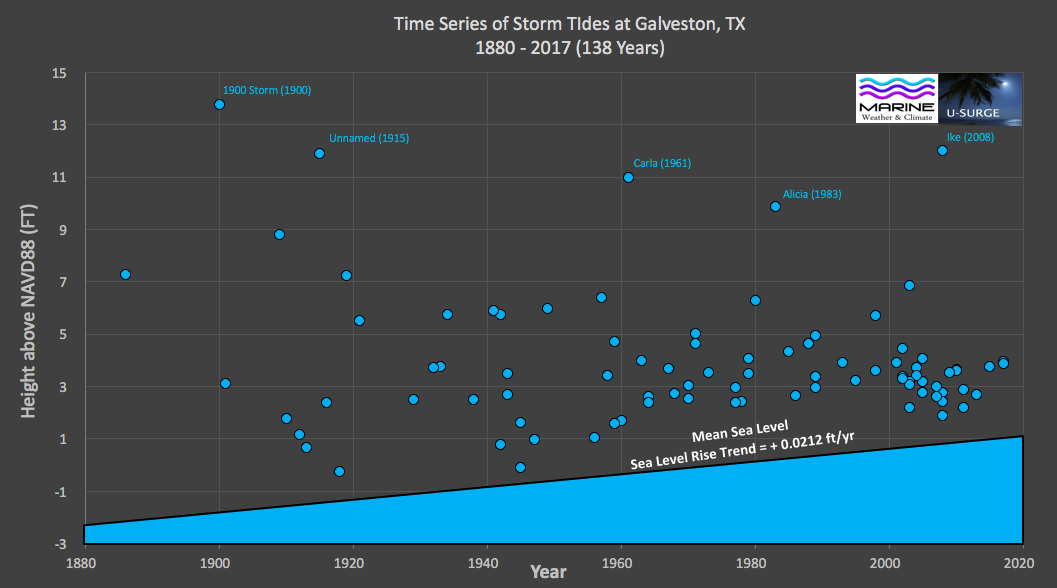
This time series provides maximum water levels from 86 recorded storm tide events at Galveston since 1880. These events are ordered chronologically from oldest (left) to newest (right). The numerous low-magnitude events in recent decades are influenced by both climate and data availability. All data are converted to NAVD88 datum, however, the data are intentionally not detrended, so the influence of relative sea level rise (SLR) is included. SLR trend taken from NOAA tide gauge at Pensacola.
Statistics/ Return Period
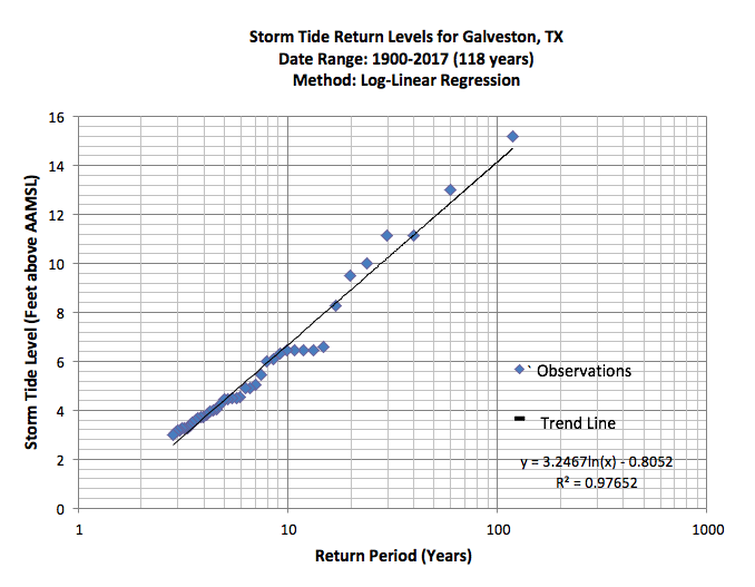
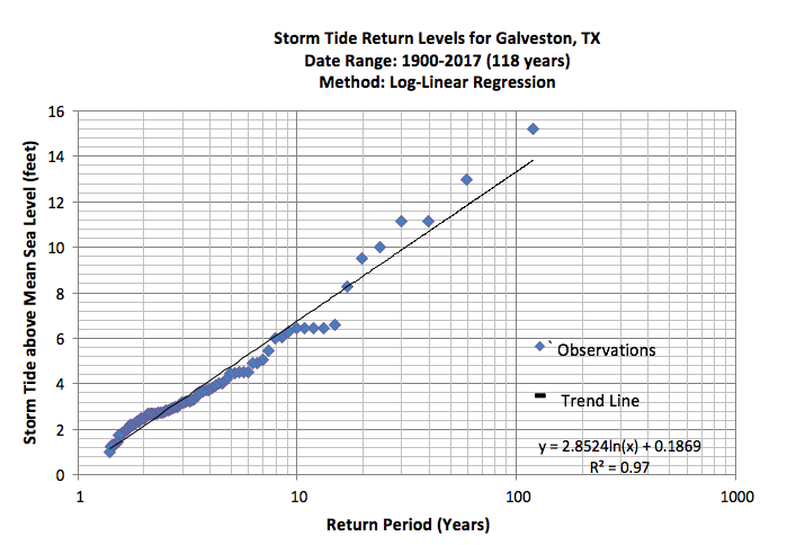
Storm tide return levels graph for Galveston. This graph uses a log-linear regression plot based on observed data from 1900-2017 (118 years). This analysis is conducted on the 42 storm tide events that are greater than or equal to 3.0 feet above the Annually-Adjusted Mean Sea Level (AAMSL). These data have been detrended to remove the influence of sea level rise.
Return Period |
Storm Tide Level (Feet above AAMSL) |
500-yr |
19.37 |
200-yr |
16.40 |
100-yr |
14.15 |
50-yr |
11.90 |
25-yr |
9.65 |
10-yr |
6.67 |
Extreme water levels above Annually-Adjusted Mean Sea Level (AAMSL) with long-term sea level rise removed. The correct way to interpret these levels is as follows: Based on a log-linear regression of observed data from 1900-2017, storm tide levels at Galveston should equal or exceed 14.15 ft every 100 years, on average, above the annually-adjusted MSL. According to the regression equation, the 15.19-ft storm tide generated by the 1900 Storm was a 138-year event.
Return period graph from December 11, 2017. This graph does not have a minimum threshold water level, meaning that all 85 observations from 1900-2017 are plotted. Note that the 100-year flood level is lower than 14 feet. On all U-Surge graphs starting April 1, 2018, a "peaks-over-threshold" approach is used, with a threshold of 3 ft. This means on newer graphs only observations great than or equal to 3 ft are plotted, providing a better statistical fit. This older graph was used for the study on the vulnerability of Galveston buildings to flooding, completed in March, 2018.
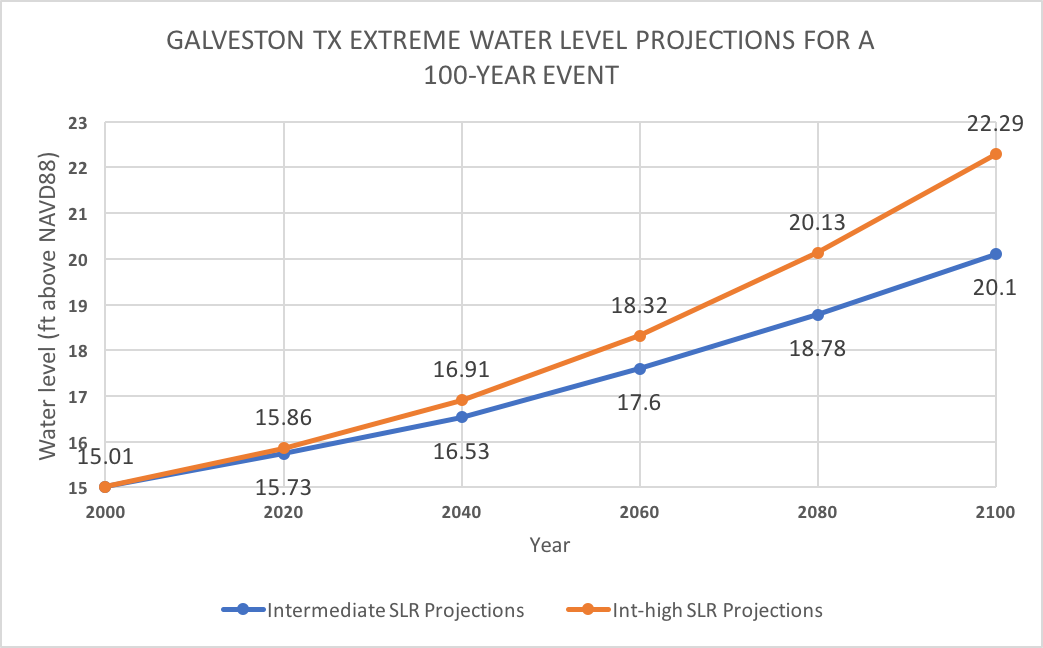
Sea Level Rise and Future Extreme Water Levels
Year |
100-Year Flood Intermediate SLR |
100-Year Flood Intermediate-High SLR |
2000 |
15.01 |
15.01 |
2020 |
15.73 |
15.86 |
2040 |
16.58 |
16.91 |
2060 |
17.60 |
18.32 |
2080 |
18.78 |
20.13 |
2100 |
20.10 |
22.29 |
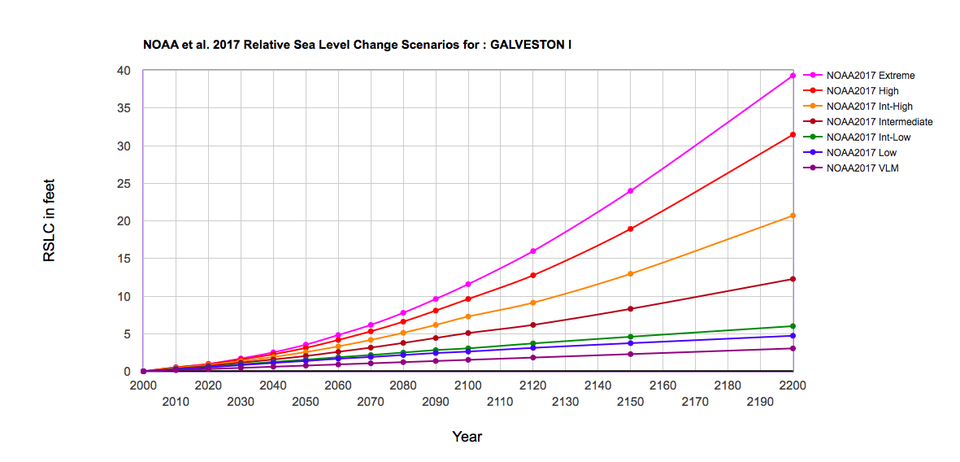
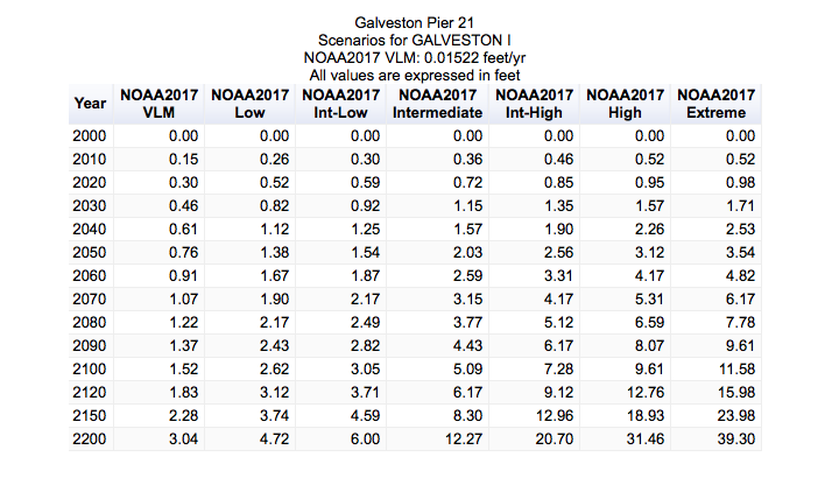
This table provides 100-year water levels above NAVD88 at different times in the past and future. These numbers are calculated by adding four values: 1) The 100-year storm tide listed in the Statistics/ Return Period section- measured in feet above AAMSL; 2) An adjustment from MSL to NAVD88, which involved adding 0.69 ft to all water levels; 3) A conversion from water levels in 1992 (the mean year of the Present Epoch) to 2000, based on a long-term SLR rate of 2.12 ft/ century at Galveston, which meant adding 0.17 ft; 4) Sea-level rise projections from NOAA (2017), shown in the Future SLR Graph and Table above.
Capture Area for Storm Surge Data
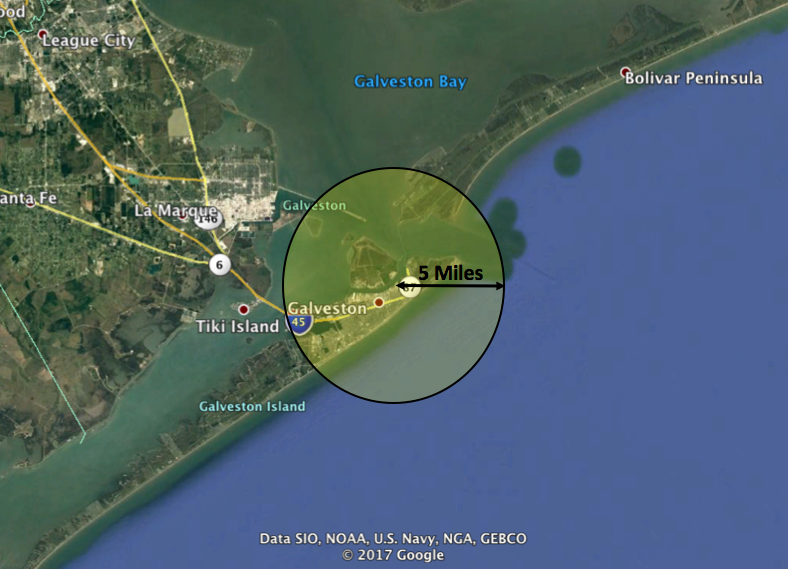
Storm surge data are taken from the area of a circle with a 5-mile radius, centered in Galveston at 29.3191N, -94.7766W. Three NOAA/ NOS tide gauges are located within this area- Galveston Pier 21, Galveston Pleasure Pier and Galveston Bay Entrance- North Jetty. If multiple observations are available for a surge event we use the highest water level from within the circular area.
Storm Surge Data Sources
Pleasure Pier
|
Tide Gauge Data from NOAA Tides and Currents
Tide Gauge Site #1: Galveston Pleasure Pier https://tidesandcurrents.noaa.gov/waterlevels.html?id=8771510 Operation: National Ocean Service (NOS) Coordinates: 29.285, -94.7883 6-min Data Water Level Data Jan 1, 1996 - Jul 20, 2011 Hourly Water Level Data Aug 21, 1957 - Feb 1, 1965 Aug 12, 1965 - Aug 24, 1973 Mar 2, 1978 - Dec 31, 1978 Aug 1, 1979 - Mar 20, 1981 May 30, 1991 - Jul 20, 2011 |

Modern-day air photo of Galveston Pleasure Pier. Infrastructure at this site has changed over time. As per NOAA Tides and Currents website, "The tide gage and staff are approximately 0.3 km (0.2 mi) SE of Seawall Boulevard on the SE corner of the pier."
|
Pier 21
|
Tide Gauge Site #2: Galveston Pier 21 tidesandcurrents.noaa.gov/waterlevels.html?id=8771450 Operation: National Ocean Service (NOS) Coordinates: 29.31, -94.7933 6-min Water Level Data Jan 1, 1996 - Present Hourly Water Level Data Jan 1, 1904 - Feb 1, 1916 May 31, 1916- Jul 1, 1943 Oct 15, 1943 - Oct 8, 1976 Jul 12, 1977 -May 2, 1984 Oct 27, 1984 - Present Note: Data availability are provided by NOAA Tides and Currents website. However, data are missing from August 1915 - May 1915. Apparently, the hurricane/ surge event in August 1915 destroyed or disabled the tide gauge. |
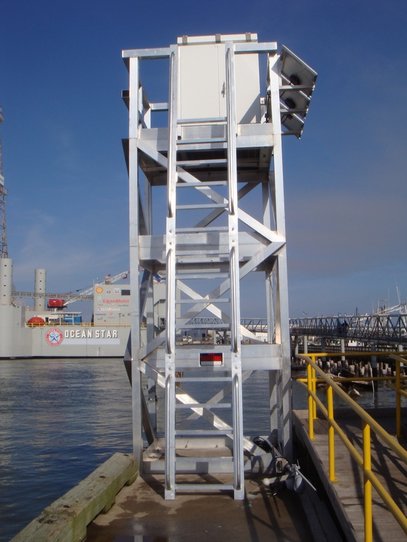
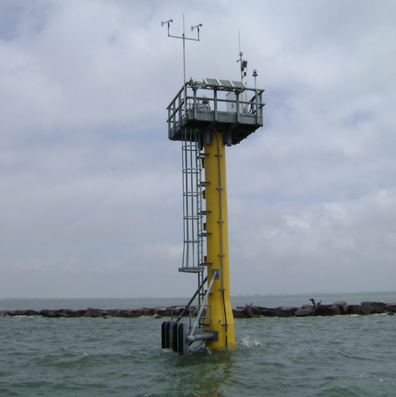
NOAA Tide Gauge at Pier 21
|
Note: The tide gauge at Galveston Pier 21 provides an extensive water level record. However, this gauge does not report many well-known storm surges from the early 1900s.
Example #1: At least four sources report a 10-foot storm surge in Galveston around July 21, 1909. However, the tide graph from this period shows only a slight rise to 0.34 ft above Mean Low Water on July 22, 1909.
Example #1: At least four sources report a 10-foot storm surge in Galveston around July 21, 1909. However, the tide graph from this period shows only a slight rise to 0.34 ft above Mean Low Water on July 22, 1909.
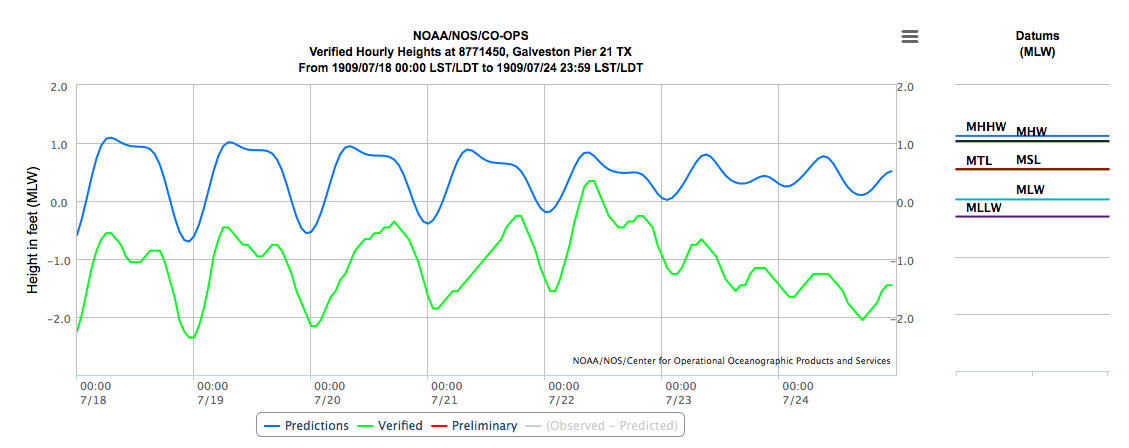
Galveston Pier 21 tide gauge observed a maximum water level of only 0.34 ft above Mean Low Water on July 22, 1909.
Example #2: Landsea et al. (2009) ( http://www.aoml.noaa.gov/hrd/hurdat/metadata_jun09.html) cite Connor as a credible reference that provides an 8.8-ft storm tide at Galveston on Sep 14, 1919 at 7:00AM. This obs seems supported by numerous high water marks in the region: Tide Info - Corpus Christi 16', Galveston 8.8', Aransas Pass 11.5', Brownsville 3.6', Port Isabel 8', Sabine 8', Anahuac 10', La Porte 8.5', Carancahua 13', Ingleside 12', Velasco 10', Port O'Connor 13' “ [These are from Landsea et al. (2009) citing Connor]
However, the NOAA/ NOS tide gauge at Pier 21 provides a high water mark of only 3.31 ft above Mean Low Water on Sep 15, 1919 at 8:00AM. This level is substantially lower (by 8.49 ft) than the other source(s).
These examples explain why U-Surge uses multiple data sources within a 10-mile radius. Even tide gauge data are sometimes inaccurate, and often fail during severe storm surges.
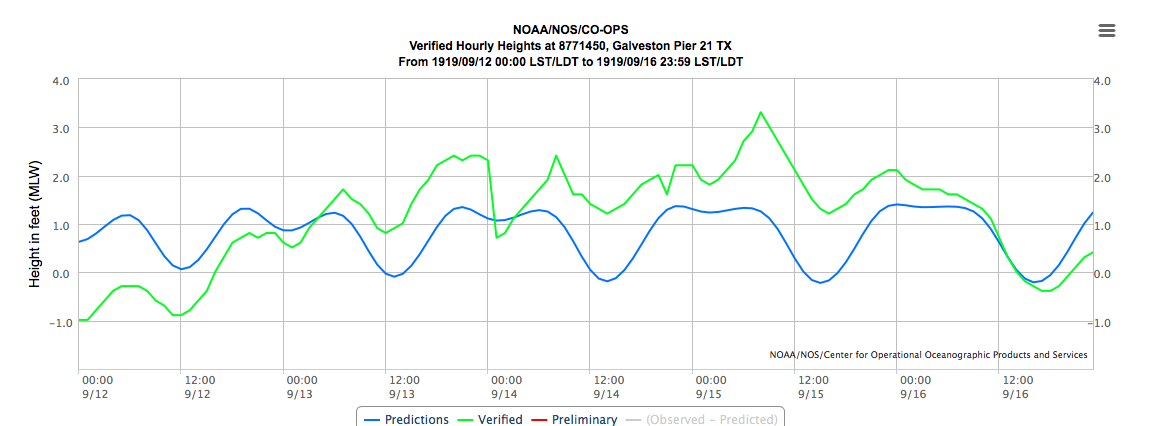
Galveston Pier 21 tide gauge recorded a maximum water level of 3,31 ft on Sep 15, 1919 at 8:00AM.
North Jetty
|
Tide Gauge Site #3: Galveston Bay Entrance, North Jetty
Operation: NOAA/ National Ocean Service (NOS) Coordinates: Lat: 29.3100, Lon: -94.7917 6-min Water Level Data Feb 22, 2001 - Sep 13, 2008 Apr 11, 2011 - Present Hourly Water Level Data Feb 22, 2001 - Sep 13, 2008 Apr 11, 2011 - Present |
Tide gauge at Galveston North Jetty
|
Pelican Split
Tide Gauge #4: U.S. Coast Guard at Pelican Split
Galveston Daily News, on June 16, 1934, stated, "The tide here was only slightly above normal last night, according to the gauge at the United States Coast Guard Station on Pelican Split." We will contact the U.S. Coast Guard soon to obtain any available data.
Galveston Channel
|
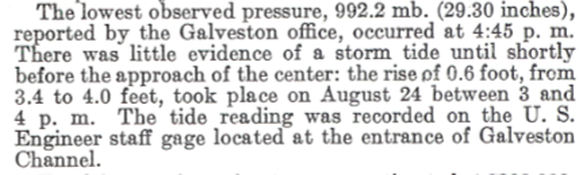
Tide Gauge #5: U.S. Army Corps of Engineers gauge at Galveston Channel A "U.S. Engineer" staff gauge operated at the entrance of Galveston Channel when an unnamed hurricane struck in August, 1947. See text below, provided by the Monthly Weather Review. Link: http://www.aoml.noaa.gov/general/lib/lib1/nhclib/mwreviews/1947.pdf |
|
Local Partnership
Mississippi/ Alabama Sea Grant, in cooperation with The Gulf of Mexico Alliance, has funded Galveston Historical Foundation to conduct a data-driven flood analysis study that incorporates both U-Surge data and first-floor elevation data derived from Google Street View. These data are crucial for understanding flood impacts in the region and for establishing a pilot project that can be modeled elsewhere.
Link to Report: https://www.u-surge.net/research.html
Link to Report: https://www.u-surge.net/research.html
Local Experts
Stan Blazyk
Local weather/ climate expert
Mr. Blazyk writes a weather/ climate column for The Daily News at: http://www.galvnews.com/blogs/weather_watch/
Author of A Century of Galveston Weather: People and the Elements on a Barrier Island. Paperback, January, 2000. 448pp.
Multi-Media
Tropical Storm Bill (2015)
Hurricane Ike (2008)
The first part of this video provides more than 9 hours of time lapse from Bermuda Beach, on Galveston Island. This location is SW of the Seawall, so we can clearly see the waves wash over the land. The video is from the daylight hours of Fri Sep 12; Ike made landfall around 1:00AM on Sat Sep 13 (local time). Note that the storm tide level increases and then decreases through the video....this may be the effect of the "forerunner wave," although tidal oscillations may play a small role as well.
Hurricane Rita (2005)
Report from Galveston, including footage of waves near the Seawall, from 10:45 - 12:05.
Hurricane Claudette (2003)
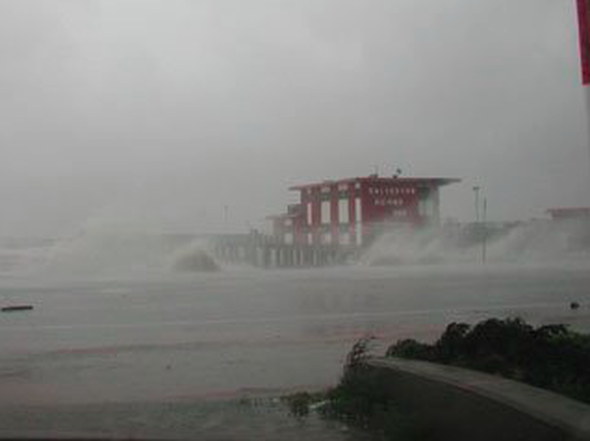
Hurricane Claudette generated storm surge and large waves that pounded against the Galveston seawall
Photo taken by Stan Blazik
Photo taken by Stan Blazik
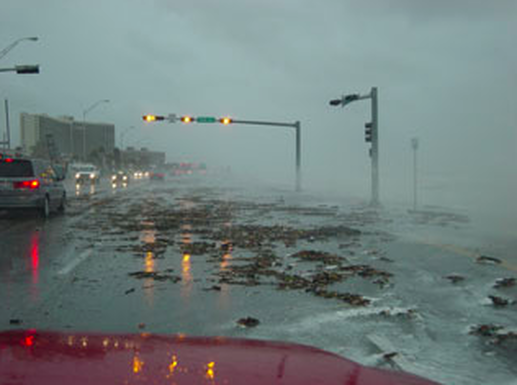
Hurricane Claudette generated storm surge and large waves that pounded against the Galveston seawall. This photo shows debris along the Seawall Boulevard, facing northeast (Gulf on the right)
Photo taken by Stan Blazik
Photo taken by Stan Blazik
Hurricane Alicia (1983)
Hurricane Allen (1980)
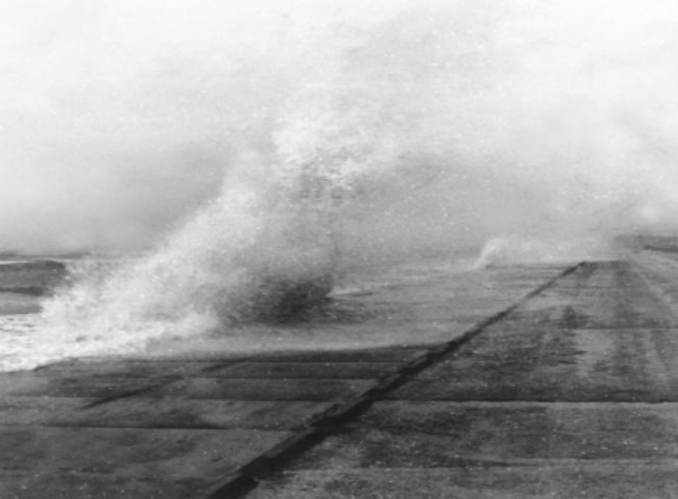
Waves from Hurricane Allen smash over the Galveston seawall, although the storm made landfall in South Texas.
Photo taken by Stan Blazyk
Photo taken by Stan Blazyk
Hurricane Carla (1961)
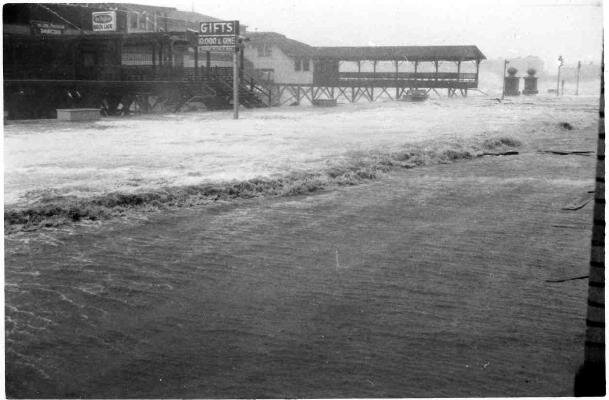
Caption from Source: Seawall storm surge prior to the actual landfall of the storm.
Hurricane Carla- 6th St. in Texas City, just north of Galveston
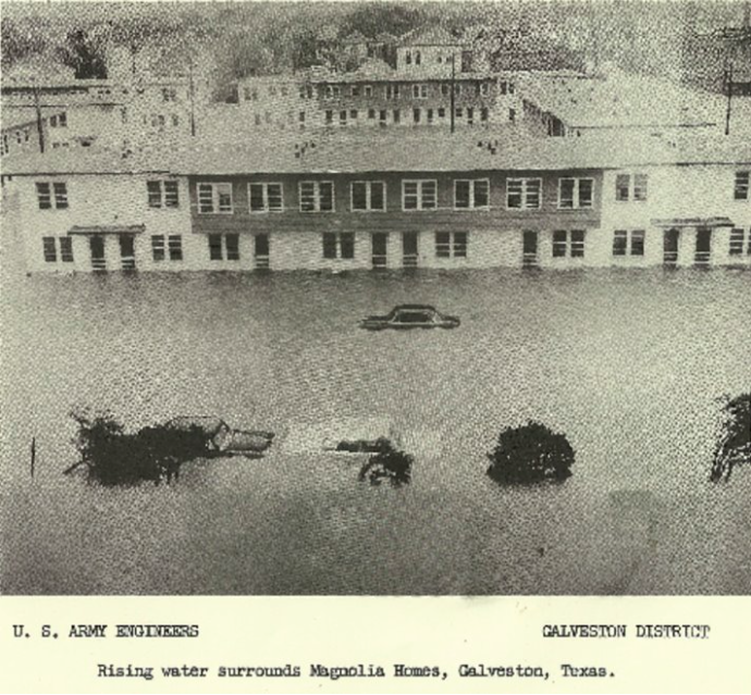
Caption: Rising water surrounds Magnolia Homes, Galveston, Texas. Source: U.S. Army Engineers, Galveston District.
Photo provided by Stan Blazyk.
Photo provided by Stan Blazyk.
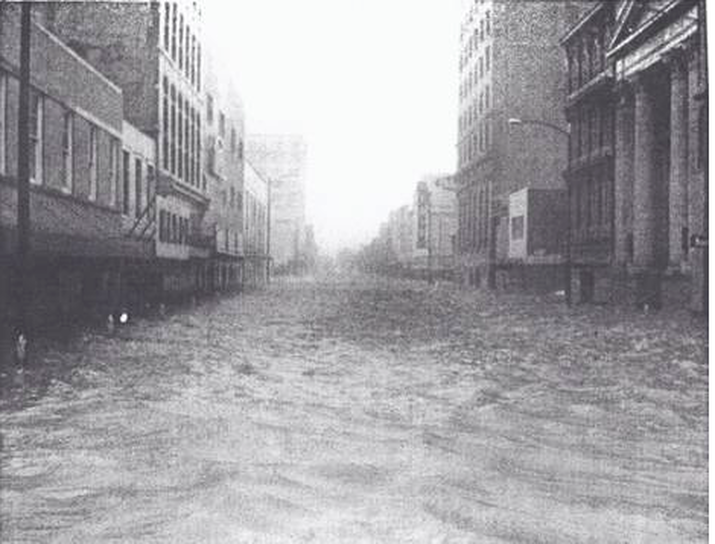
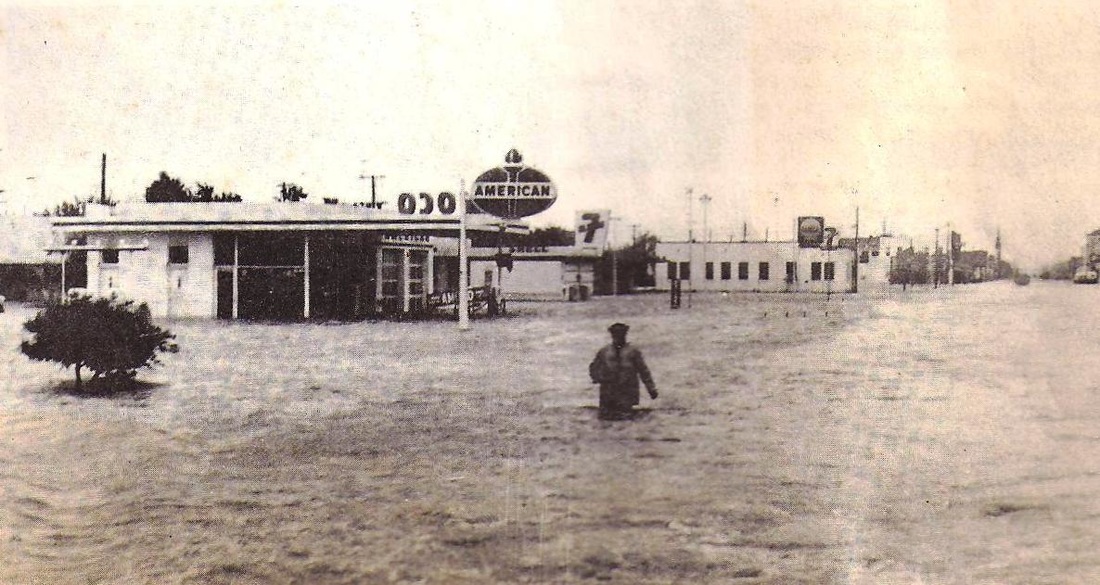
Flooding on Market Street in Galveston during Hurricane Carla.
Source: Houston Chronicle; photo provided by Stan Blazyk.
Source: Houston Chronicle; photo provided by Stan Blazyk.
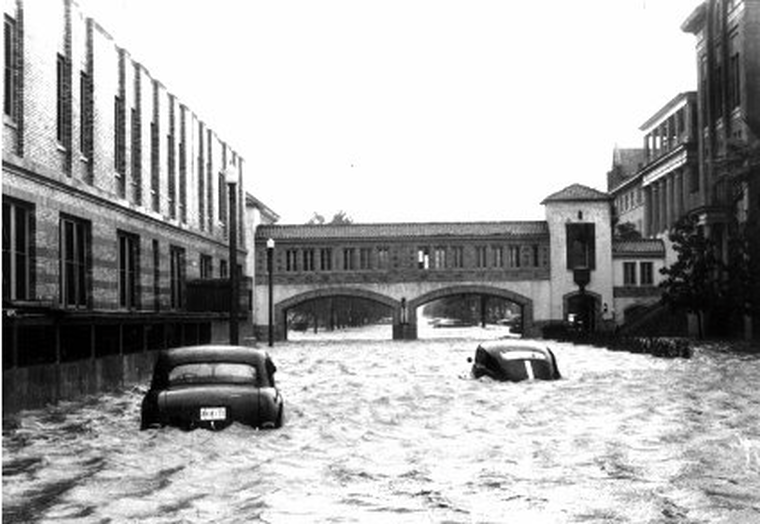
Hurricane Carla storm surge at University of Texas Medical Branch (UTMB) in Galveston
Source: Galveston County Daily News; Photo provided by Stan Blazik
Source: Galveston County Daily News; Photo provided by Stan Blazik
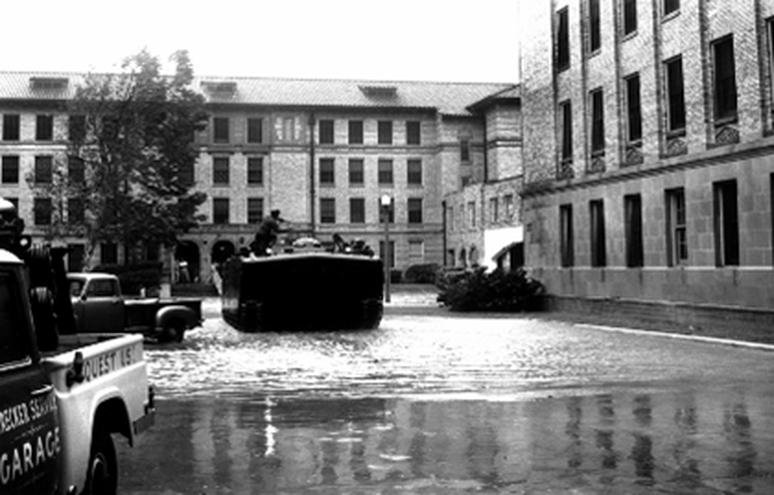
Specialized vehicles were required to traverse the floodwaters in Galveston during Hurricane Carla.
This picture is from University of Texas Medical Branch (UTMB).
Source: Galveston County Daily News; Photo provided by Stan Blazik
This picture is from University of Texas Medical Branch (UTMB).
Source: Galveston County Daily News; Photo provided by Stan Blazik
Dan Rather talks about how his Hurricane Carla coverage from Galveston was his first big break. This video shows some storm surge clips, makes references to the inundation and talks about the "thousands of snakes" that were seen on Galveston Island.
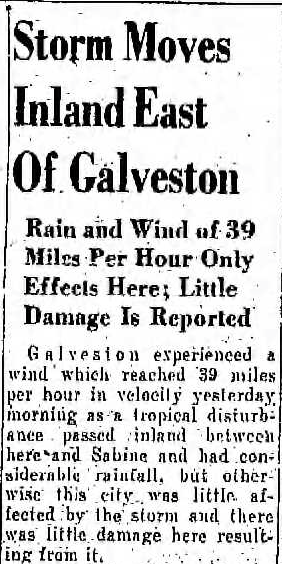
Unnamed Hurricane (1949)
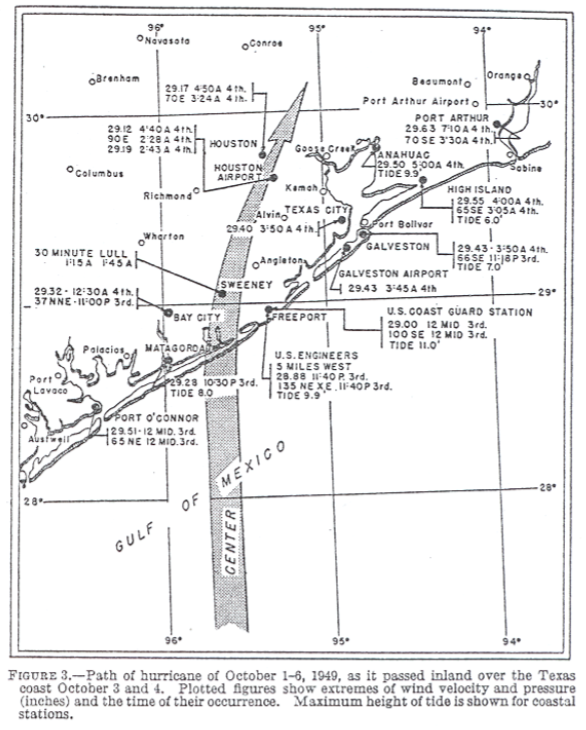
Source: Monthly Weather Review, December, 1949, Pg. 341
Unnamed Hurricane (1943)
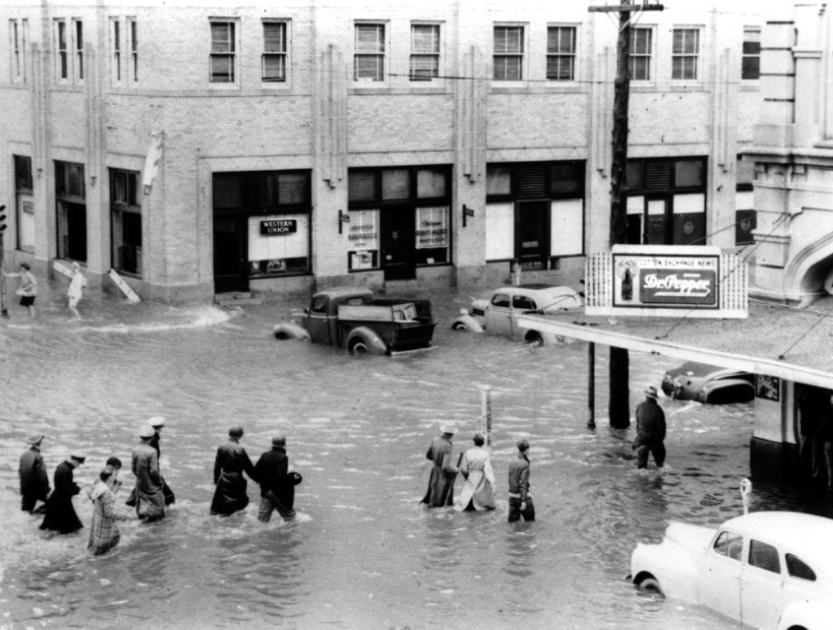
Flooding in downtown Galveston during the July, 1943 Hurricane. Although the peak tide level was only 3.9' above what would have been expected normally, 13.16 inches of rain in the space of a little over 6 hours overwhelmed the drainage system (already sluggish from the higher tides) and led to widespread flooding...especially north of Broadway.
Photo: Galveston County Daily News; Photo and caption provided by Stan Blazik
Photo: Galveston County Daily News; Photo and caption provided by Stan Blazik
Unnamed Hurricane (August 21, 1942)
The Galveston Daily News, August 22, 1942, Page 1
Unnamed Tropical Storm (September, 1940)
Galveston Daily News: September 24, 1940
Unnamed Hurricane (August, 1940)
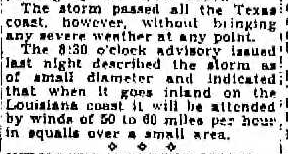
The unnamed hurricane in August, 1940, provides an excellent example of the value of historic hurricane/ surge data. This storm made landfall in extreme SE Texas as a category-2 hurricane, but generated a lower-than-normal water level at Galveston. The storm tracked so close to the coast that the winds ahead of it were offshore and Galveston never observed onshore winds.
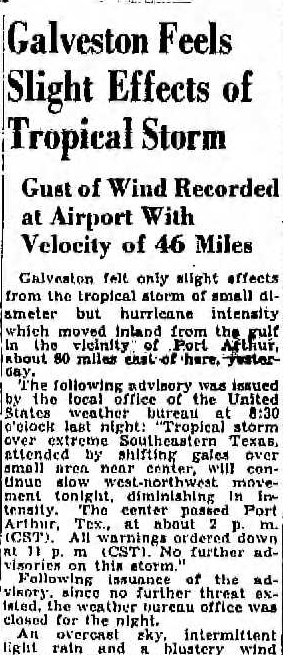
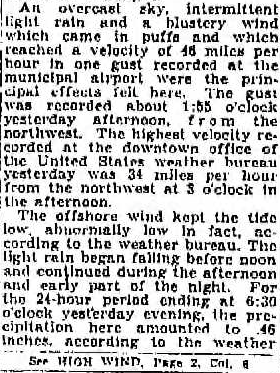
Galveston Daily News: August 8, 1940, Page 1
Unnamed Hurricane (August, 1934)
Galveston Daily News, Aug 28, 1934, Page 3
Unnamed Hurricane (1919)
This video depicts the storm surge created by the unnamed hurricane (1919) in Galveston, Texas.
Unnamed Hurricane (1915)
Unnamed Hurricane (1909)

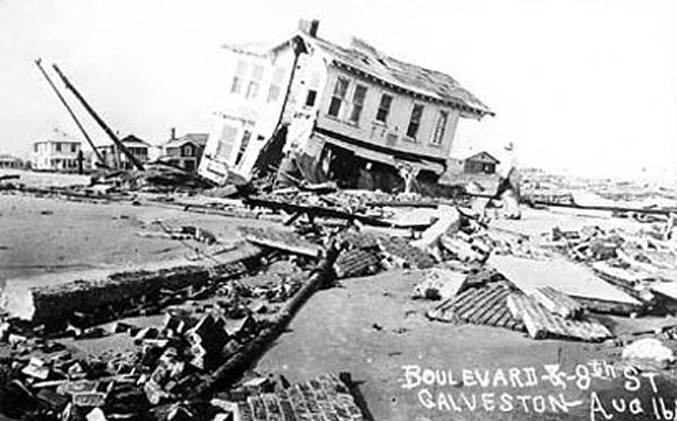
Caption from Source: 1909 Storm Debris

The storm surge from the 1909 hurricane was the first test for Galveston's new seawall, which was completed in 1904.
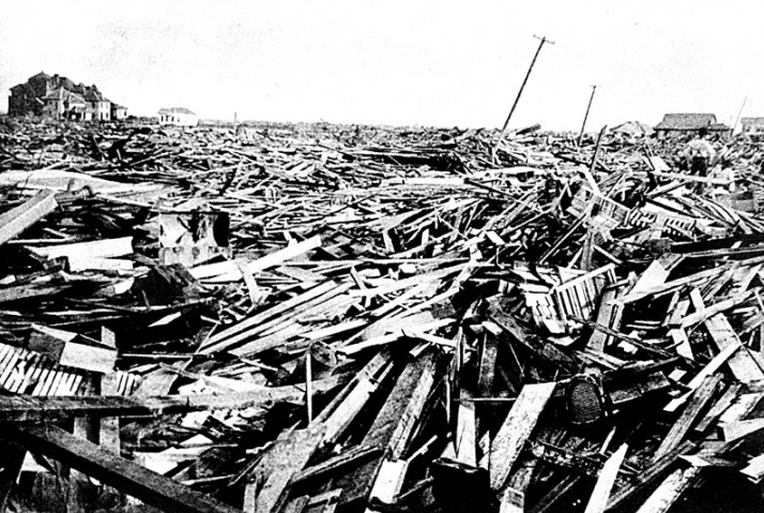
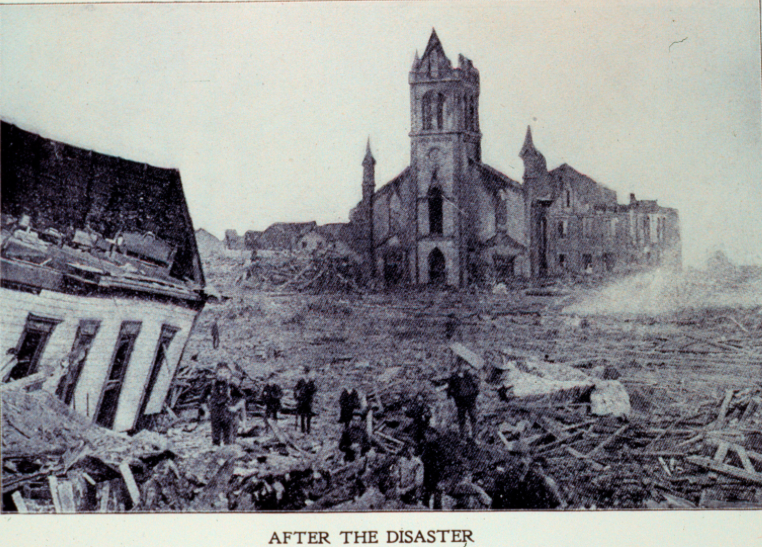
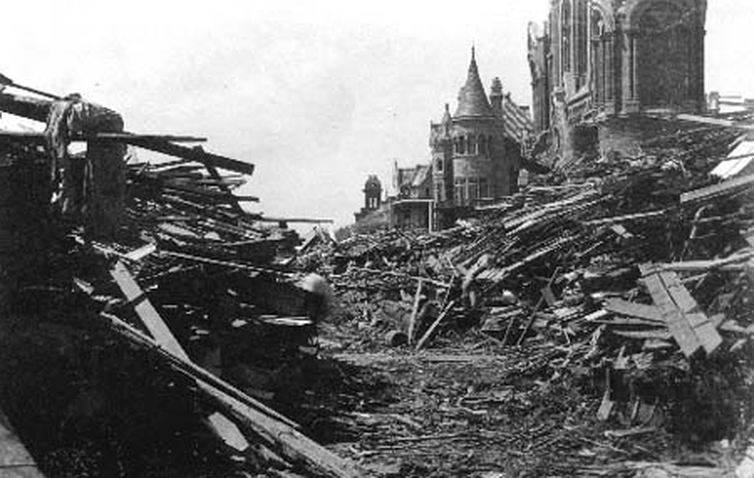
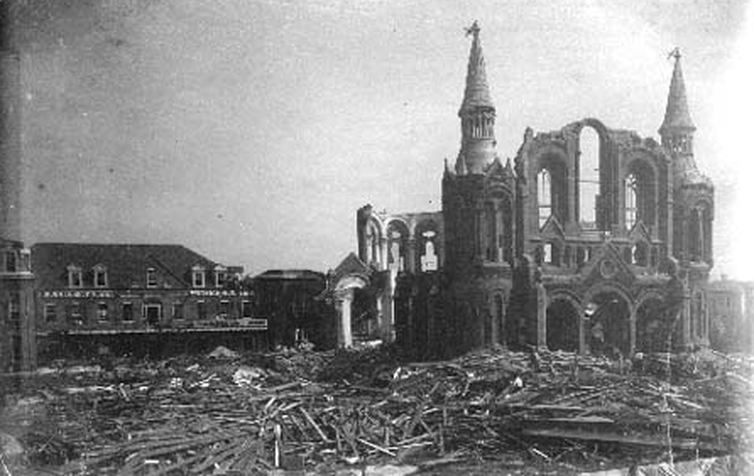
1900 Galveston Hurricane