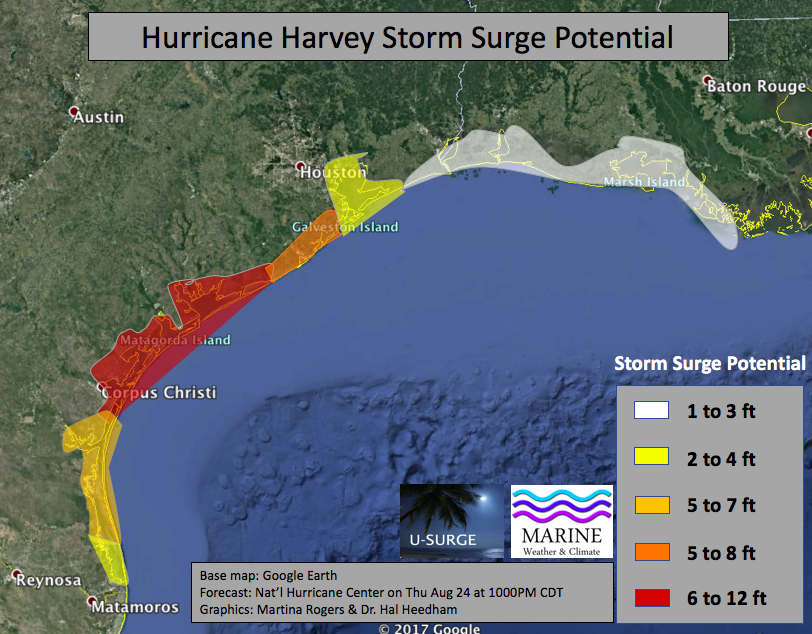
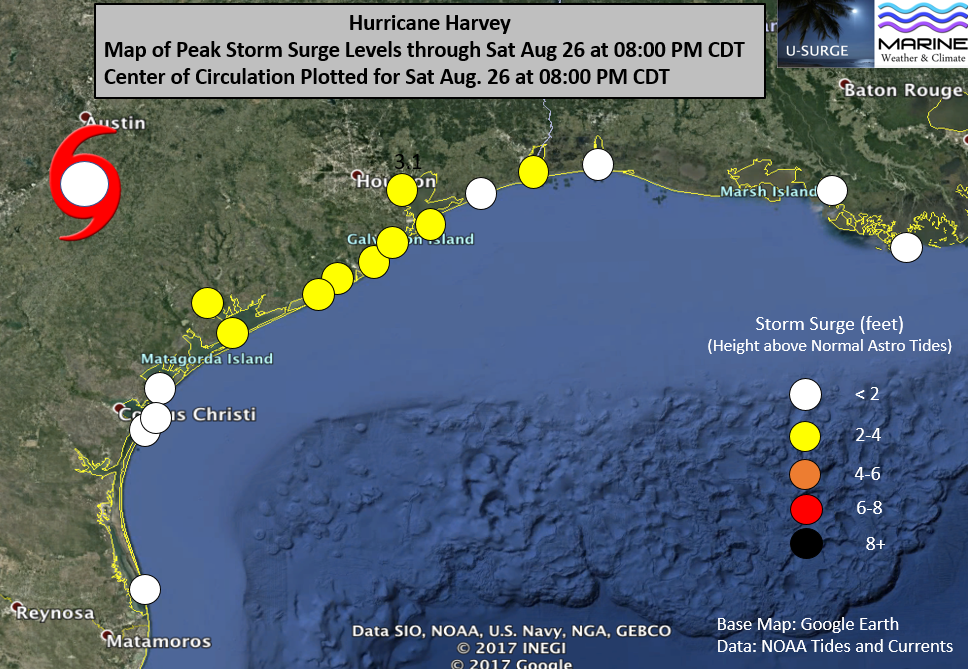
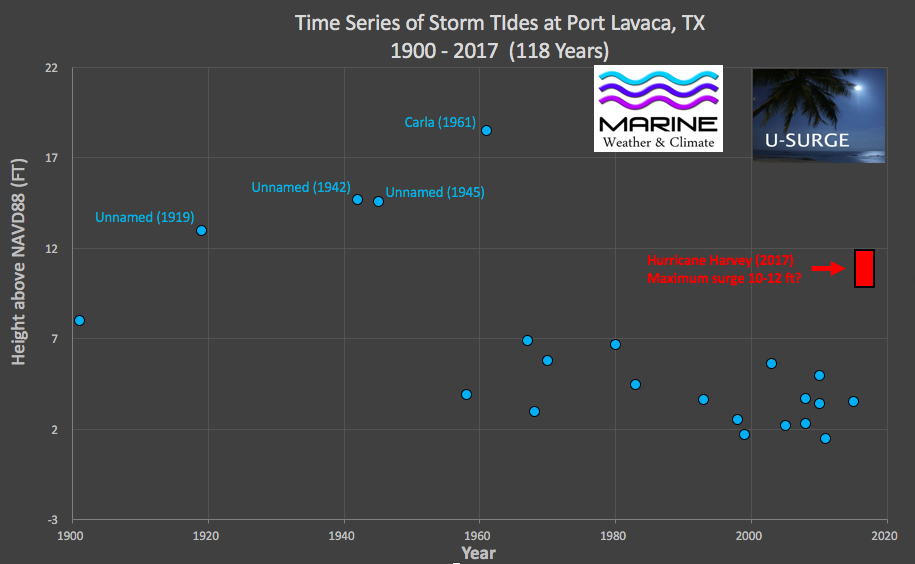
U-SURGE
  • Home
  • About
  • U.S. Cities
    • US Atlantic Coast (North) >
      • Rhode Island >
        • Newport
        • Providence
      • Massachusetts >
        • Boston
      • Connecticut >
        • New London/ Groton
      • New Jersey >
        • Cape May
        • Atlantic_City
        • Sandy Hook/ North Jersey
      • New York >
        • New York City
    • U.S. Gulf Coast >
      • Texas >
        • South Padre Island
        • Corpus Christi
      • Mississippi
      • Alabama
      • Florida
  • Contact


​Hurricane Harvey

Picture
Stay tuned with the latest information on Hurricane Harvey's storm surge

Updated Storm Surge and Weather Info

Storm Surge Forecast

Picture

Regional Storm Surge Observations

Maximum storm surge heights along the western Gulf Coast during Hurricane Harvey. The maximum recorded water level from a NOAA Tides and Currents gauge was observed at Port Lavaca, where surge levels exceeded 6 ft.  Widespread 2-4' surge has been observed from Port O'Connor to Galveston Bay.
Picture

Hurricane Harvey Radar Loop

Picture
Click on the image above to view Brian McNoldy's excellent storm radar loop.


Storm Surge Climatology


Port Lavaca

Picture
Time series of storm tide (surge + tide) levels at Port Lavaca above Mean Sea Level (MSL) from 1900-2017 (118 years). Hurricane Harvey likely generated a 10-12 foot storm tide near Port Lavaca, although the highest observed level reported was 7.0 feet above MSL on Sat Aug 26 at 3:48AM CDT. Harvey generated the highest storm tide at Port Lavaca since Hurricane Carla in 1961, and the 5th highest storm tide since 1919. Observations are graphed chronologically from oldest (left) to newest (right). Absence of low-magnitude storm tide events before Ella (1958) is influenced by under-reporting, and does not necessarily indicate a lack of actual storm tide events. 


​Corpus Christi

Picture
Harvey generated the 17th highest recorded storm tide (surge + tide) level on record at Corpus Christi since 1900 and the highest storm tide since Hurricane Alex (2010). Blue dots are storm tide data converted to NAVD88 datum. Data are sorted chronologically from oldest (left) to newest (right). The red circle and line depict Harvey's highest water level in the Corpus Christi area (Bob Hall Pier) as of Fri Aug 25 at 500PM CDT. Higher storm surge levels may have occurred in the Corpus Christi region but have not yet been reported.

Storm Surge Multimedia

 Hurricane Harvey (Aug. 25, 2017) has produced major flooding due to high storm surge. This video shows how fast the sea water moves to the streets of Texas.

​Communication

Vertical Divider
Picture
Read the latest from Hurricane Hal's Storm Surge Blog
Vertical Divider
Picture
Connect with the broader Texas and storm communities
Vertical Divider
Picture
Get in touch with the U-Surge team directly


U-Surge Team​

​Dr. Hal Needham

Nick McIntyre

Shanna Haley
Martina Rogers

Harley Guarnere
​
Aaron Flores
© 2017 Marine Weather & Climate. All rights reserved.
  • Home
  • About
  • U.S. Cities
    • US Atlantic Coast (North) >
      • Rhode Island >
        • Newport
        • Providence
      • Massachusetts >
        • Boston
      • Connecticut >
        • New London/ Groton
      • New Jersey >
        • Cape May
        • Atlantic_City
        • Sandy Hook/ North Jersey
      • New York >
        • New York City
    • U.S. Gulf Coast >
      • Texas >
        • South Padre Island
        • Corpus Christi
      • Mississippi
      • Alabama
      • Florida
  • Contact