Mandeville

About MandevilleComing Soon....
|
Storm Surge HistoryThe U-Surge project provides high water marks for 38 hurricanes and tropical storms at Mandeville since 1900. This location has an unusual storm surge history, with the past two decades experiencing a time of hyperactive storm surge activity. In fact, the four highest water levels on record have occurred during this period, from Tropical Storm Isidore (2002), Hurricane Katrina (2005), Hurricane Rita (2005) and Hurricane Isaac (2012). Hurricane Katrina generated the highest water level on record, with an observation of 10.30 feet above NAVD88 datum.
|
Infographics
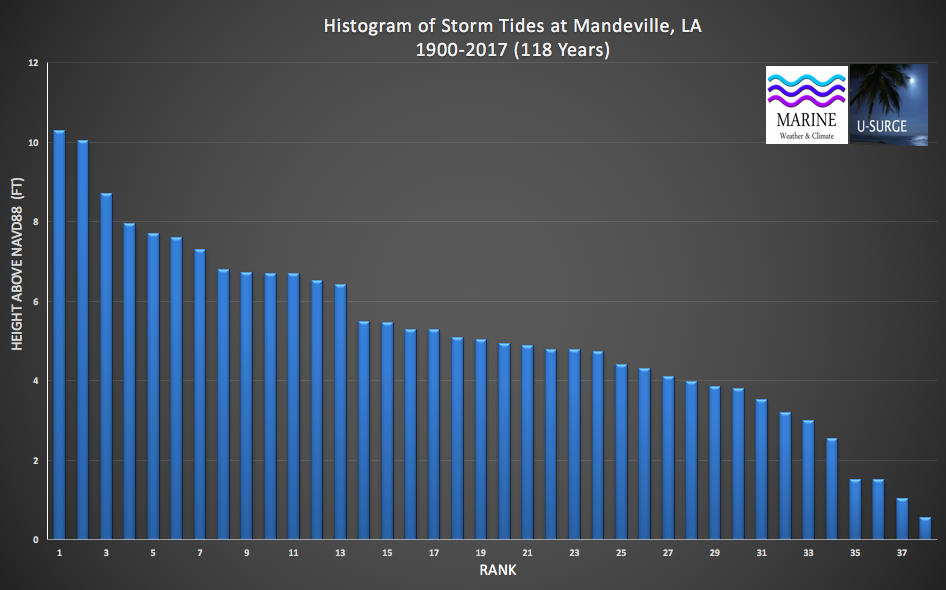
This histogram provides the maximum water levels of the 38 recorded storm tide events at Mandeville since 1900. The events are ordered from the highest water level (Rank = 1) to lowest (Rank = 38). These events are not placed in chronological order. All data are detrended to remove the influence of relative sea level rise, so they represent water levels above an Annually-Adjusted Mean Sea Level (AAMSL).
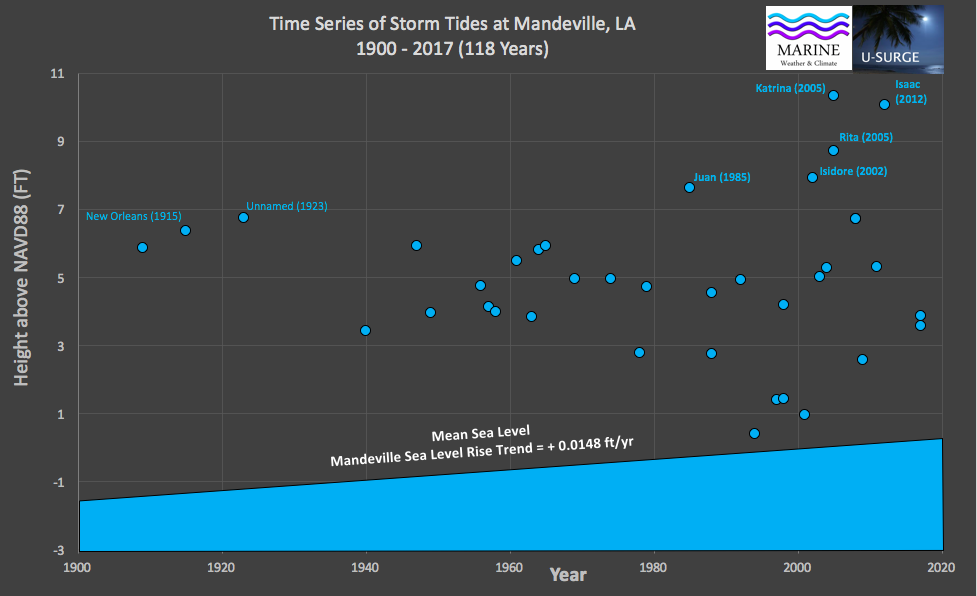
This time series provides maximum water levels from 38 recorded storm tide events at Mandeville since 1900. These events are ordered chronologically from oldest (left) to newest (right). The lack of low-magnitude events from 1900-1939 are influenced by data availability and do not necessarily depict changes in climate. All data are converted to NAVD88 datum, however, the data are intentionally not detrended, so the influence of relative sea level rise is included.
Statistics/ Return Period
Return Period (Years) |
Water Level (Feet above AAMSL) |
500 |
13.65 |
200 |
11.88 |
100 |
10.54 |
50 |
9.20 |
25 |
7.86 |
10 |
6.09 |
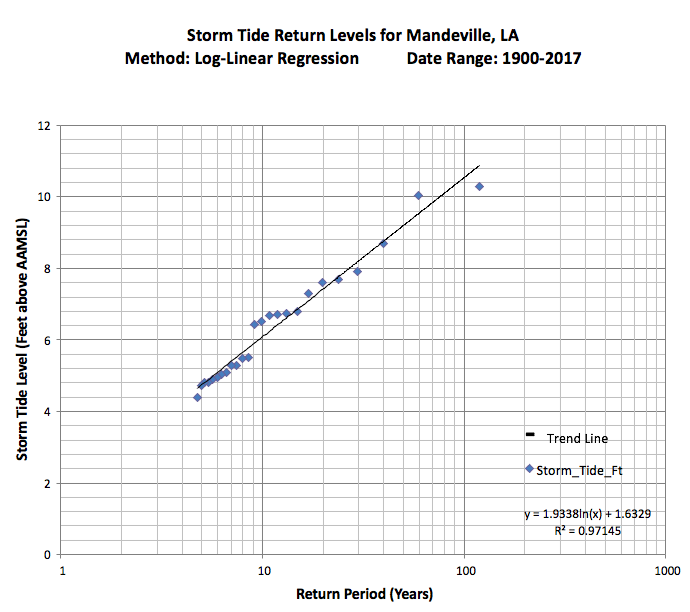
According to these statistics, Hurricane Katrina's 10.30-ft storm tide, the highest on record at Mandeville, has a return period of 88 years. This means we should expect to see Katrina's water level matched or exceeded on average one time every 88 years, not including the influence of subsidence/ sea-level rise.
Sea Level Rise and Future Extreme Water Levels
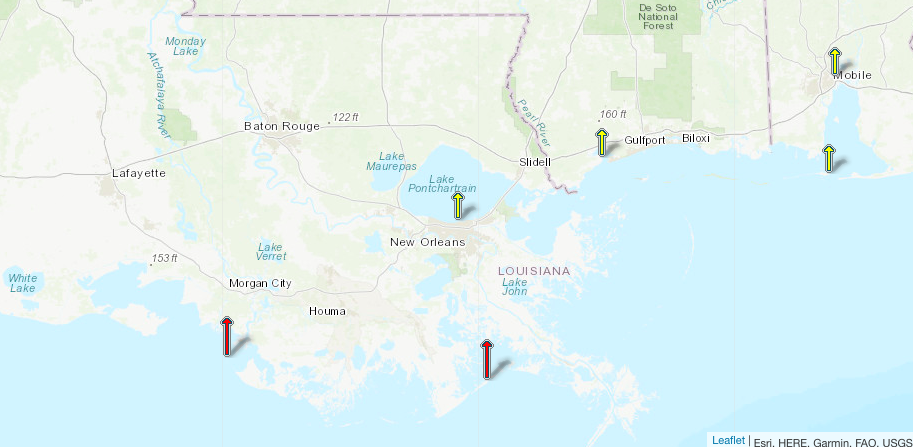
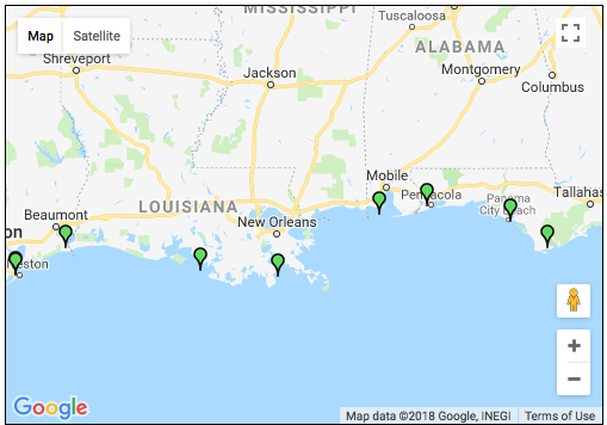
NOAA Tides and Currents provides historical sea-level trends for numerous coastal locations (map above), however, data are not available for Mandeville (see map above). The closest NOAA sea-level trends location to Mandeville is New Canal Station in New Orleans, but this site represents sea-level rise rates of Lake Pontchartrain's south shore, which are faster than the north shore. Fortunately, Penland and Ramsey (1990) provide long-term sea-level rise trends for the region. Based on 58 years of data, they list the sea-level rise rate as 0.0148 ft/year (1.48 ft/ century) in Mandeville, which is less than half the rate of Lake Pontchartain's south shore, where Penland and Ramsey list a sea-level rise trend of 0.0331 ft/ year (3.31 ft/ century).
REFERENCES
NOAA Sea-Level Trends: https://tidesandcurrents.noaa.gov/sltrends/sltrends.html
Penland, S., and K.E. Ramsey, 1990: Relative Sea-Level Rise in Louisiana and the Gulf of Mexico: 1908-1988. Journal of Coastal Research, 6, 323-342.
REFERENCES
NOAA Sea-Level Trends: https://tidesandcurrents.noaa.gov/sltrends/sltrends.html
Penland, S., and K.E. Ramsey, 1990: Relative Sea-Level Rise in Louisiana and the Gulf of Mexico: 1908-1988. Journal of Coastal Research, 6, 323-342.
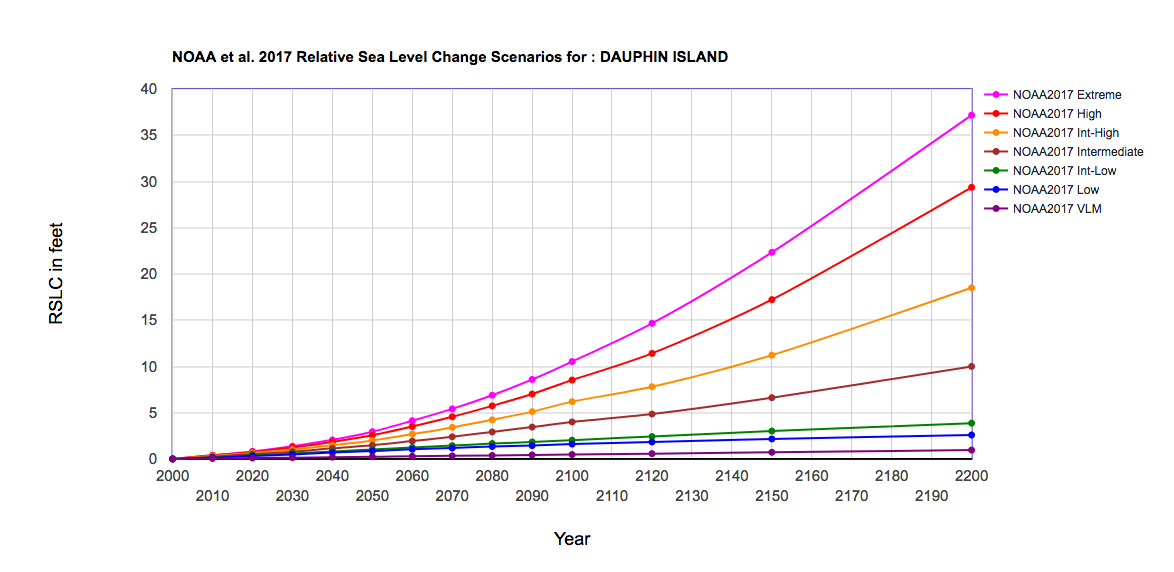
NOAA (2017) Sea Level Rise trends at Dauphin Island, Alabama, approximately 116 miles east of Mandeville.
NOAA (2017) provides sea-level rise projections for multiple locations along the northern Gulf Coast. Although the Grand Isle location is closer to Mandeville (78 miles SSE), Dauphin Island (116 miles E) is the closest location with similar sea-level rise projections to Mandeville.
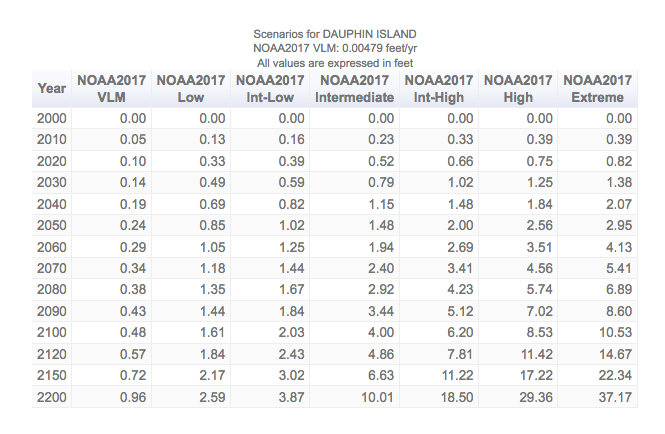
Future SLR table for Dauphin Island, Alabama, which most closely resembles Mandeville.
Storm Surge Data Sources
|
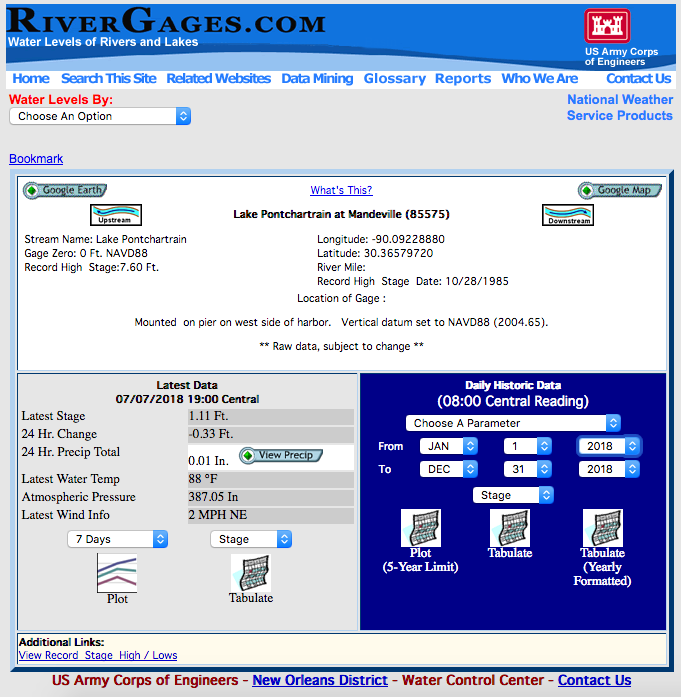
Tide Gauge: Lake Pontchartrain at Mandeville (85575)
Operation: U.S. Army Corps of Engineers Coordinates: Lat: 30.36579720, Lon: -90.09228880 Data Availability (Online): 1911, 2007-Present |
|
|
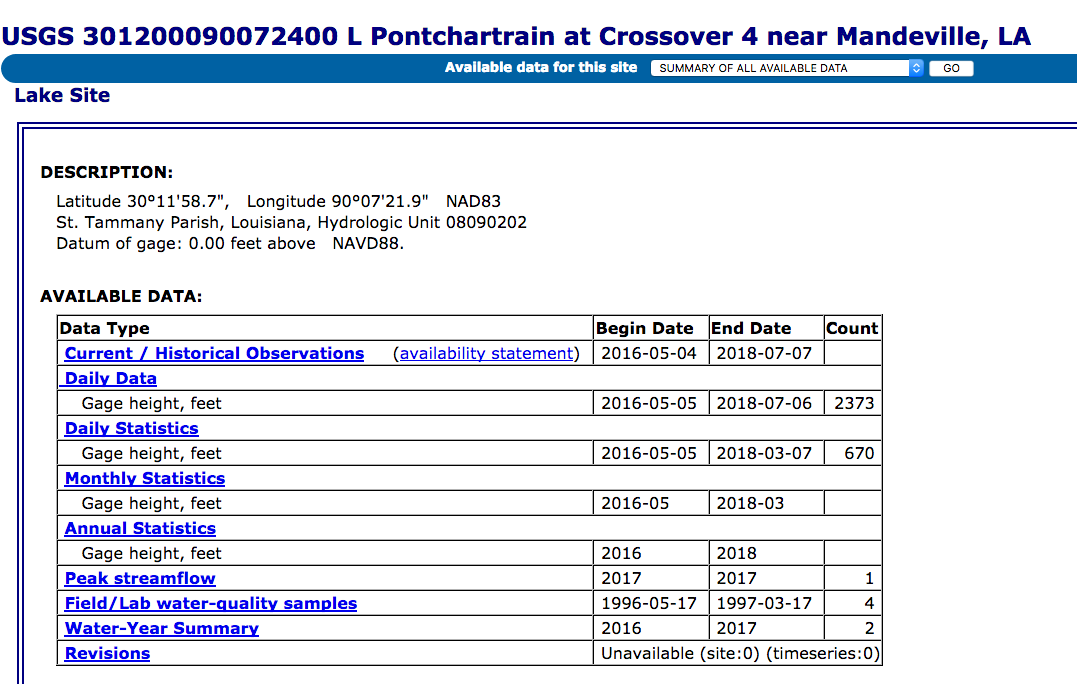
Tide Gauge: L Pontchartrain at Crossover 4 nr Mandeville
Operation: United States Geological Survey (USGS) Coordinates: Lat: 30.199639, Lon: -90.12275 Data Availability (Online): May 4, 2016 - Present Link: https://waterdata.usgs.gov/la/nwis/inventory/?site_no=301200090072400&agency_cd=USGS |
|
IMPORTANT NOTE: The USGS tide gauge is labeled as "near Mandeville", however, it's position is closer to the center of Lake Pontchartain. The distance from this gauge to the shoreline at Mandeville is approximately 11 miles. Therefore, data from this site were not used for Mandeville's U-Surge Project (see below):
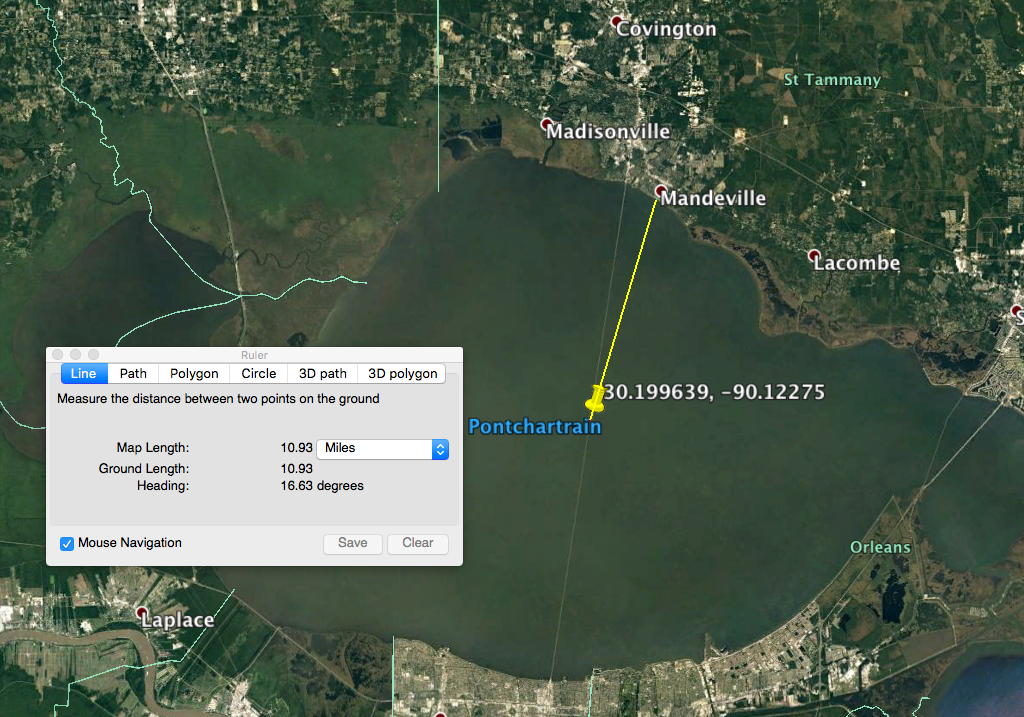
The distance from the USGS tide gauge to the shoreline at Mandeville is approximately 11 miles.
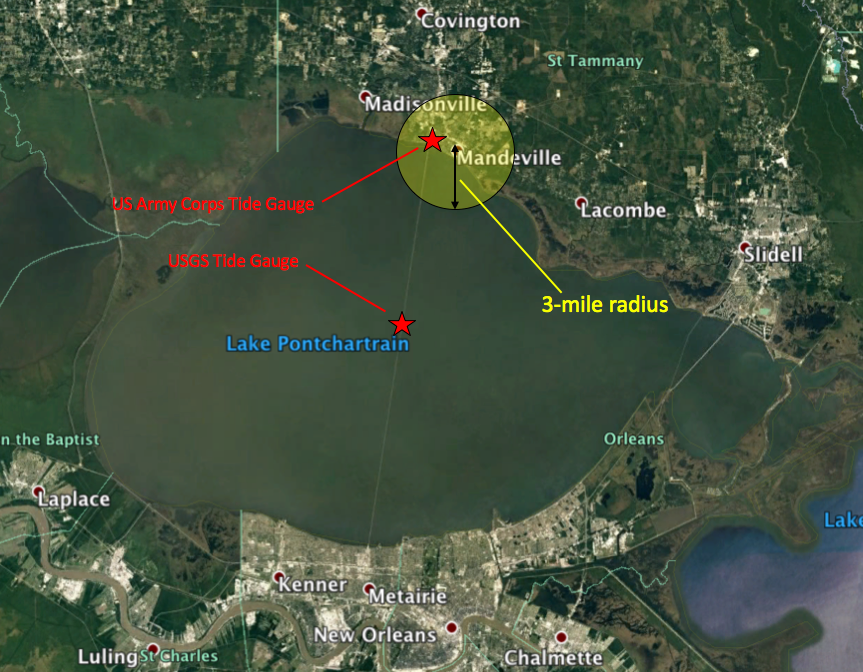
Mandeville U-Surge data come from a circle with a 3-mile radius centered on LAT/LON (inside the yellow circle on map). These data include observations from the U.S. Army Corps tide gauge and high water marks from within Mandeville. Data from the USGS tide gauge near the middle of Lake Pontchartrain are not included in the Mandeville data.
Missing Data
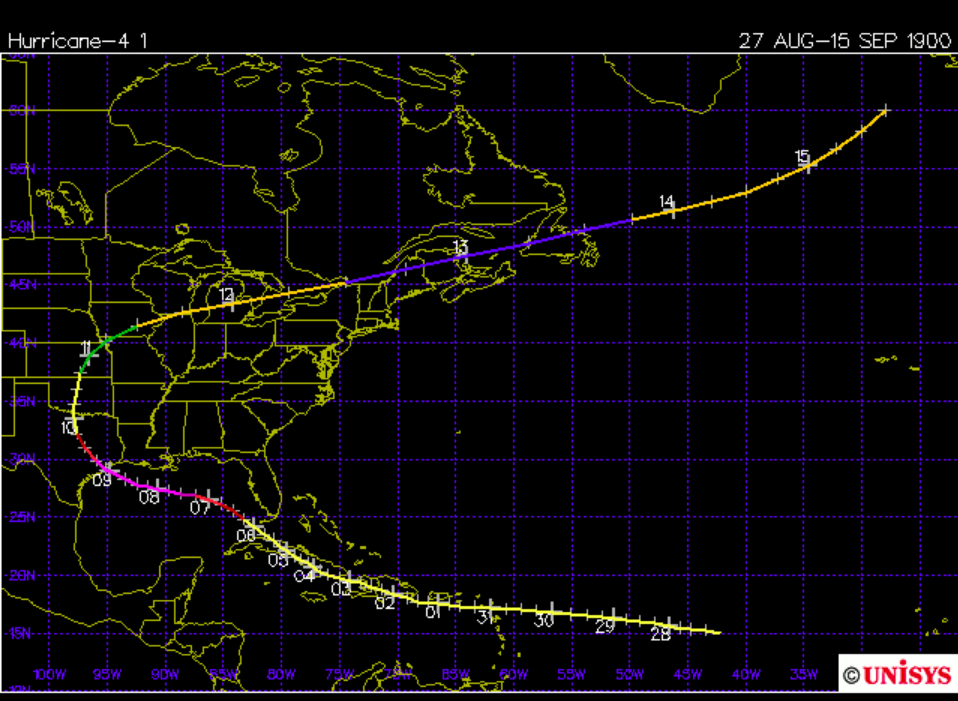
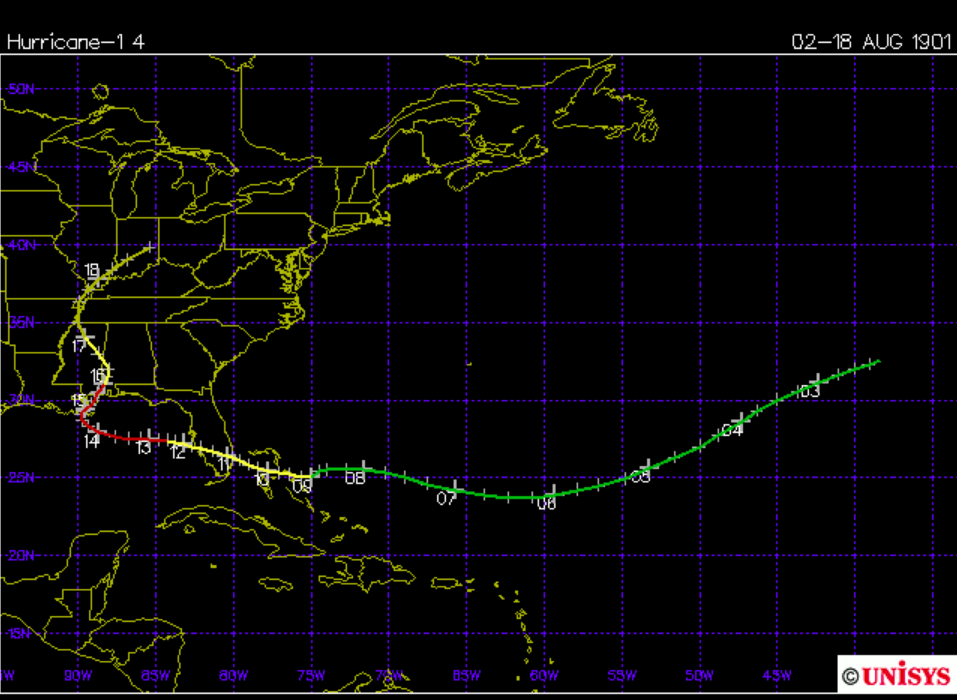
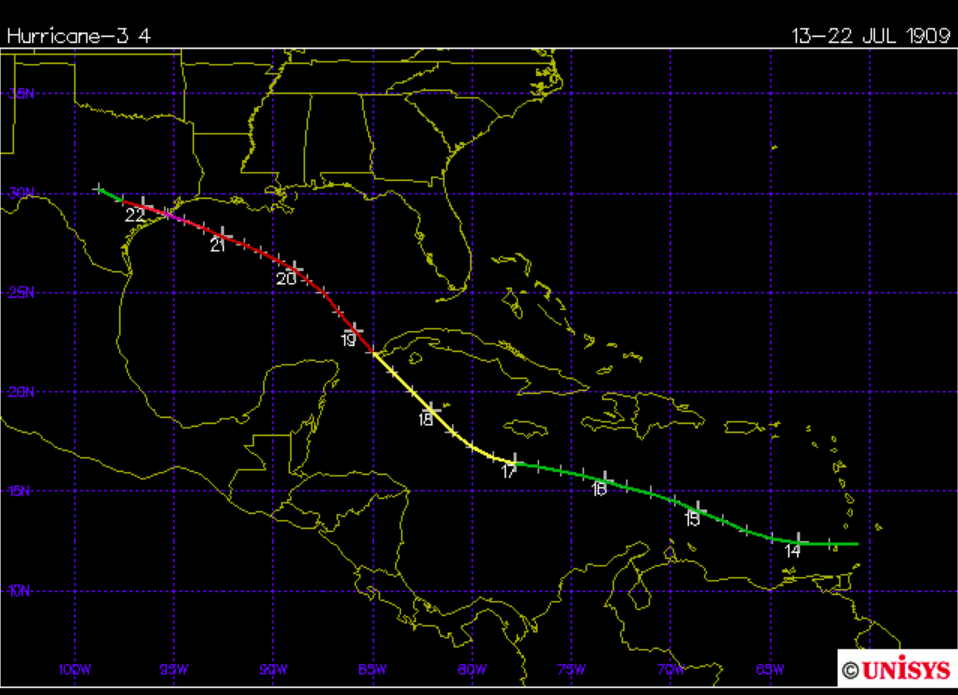
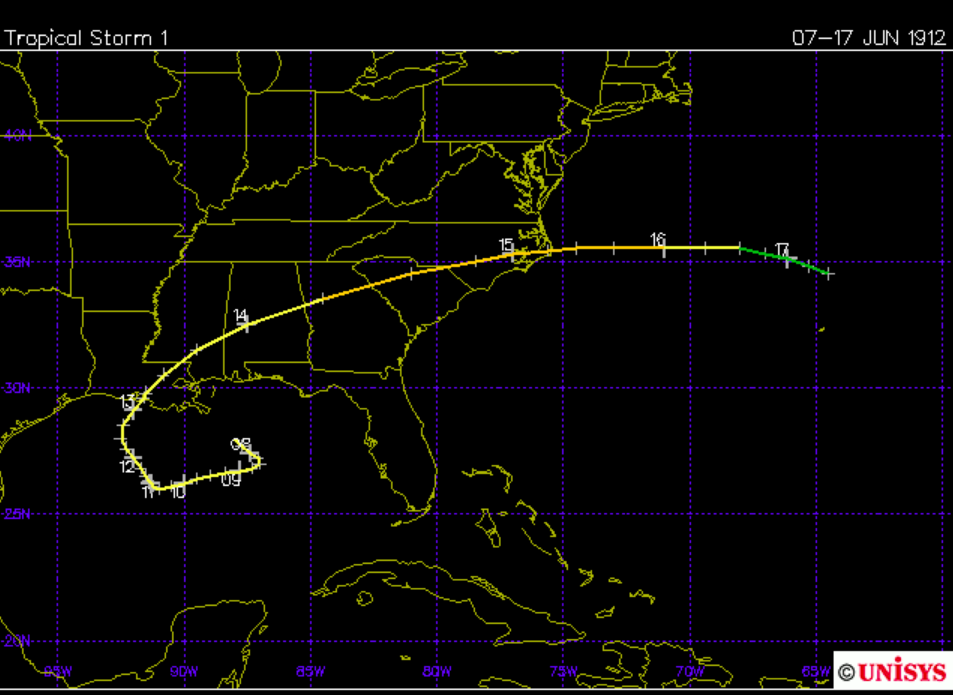
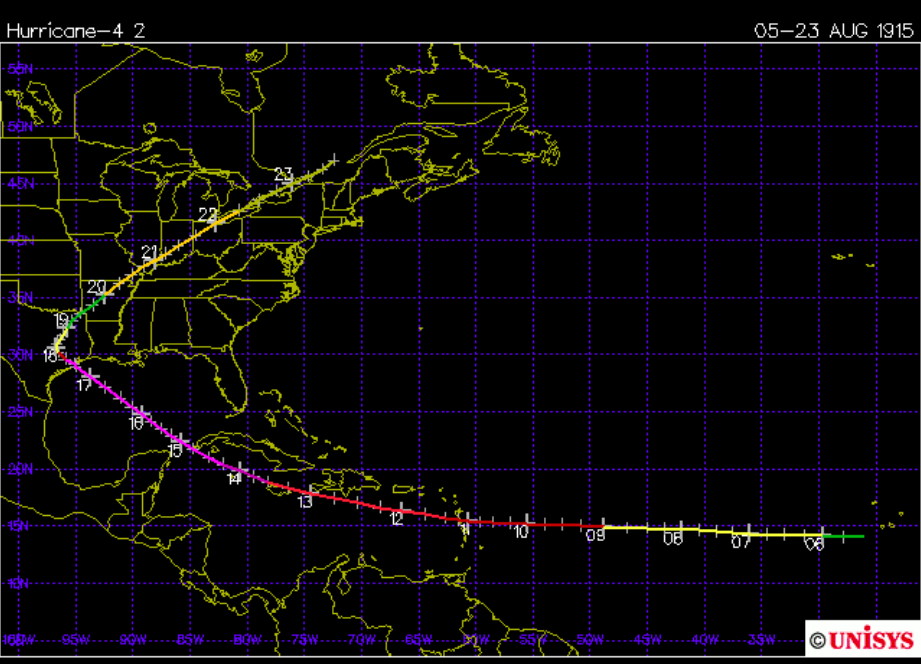
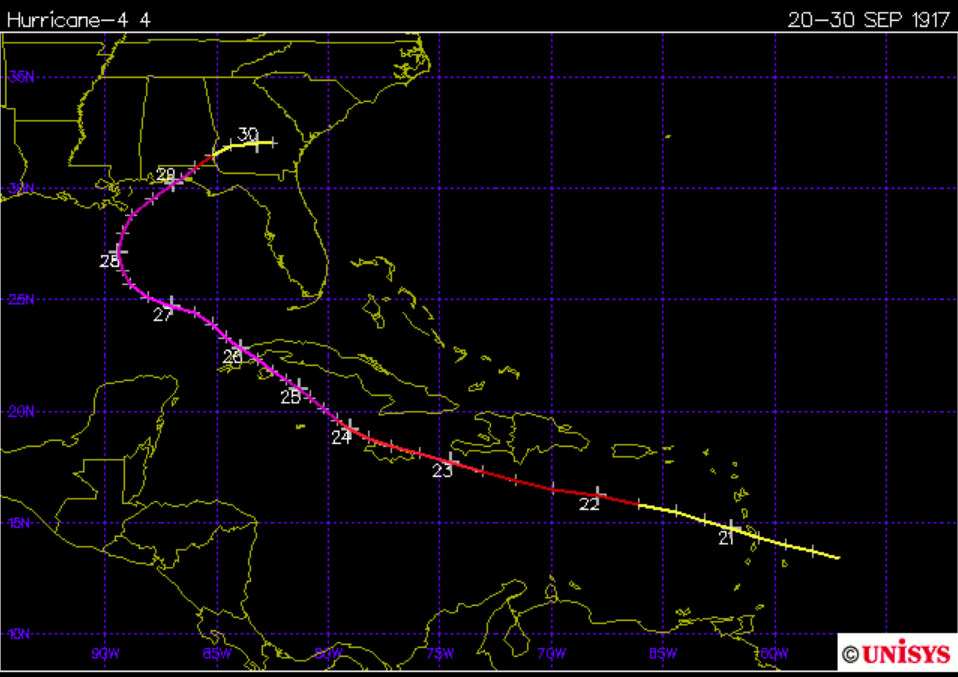
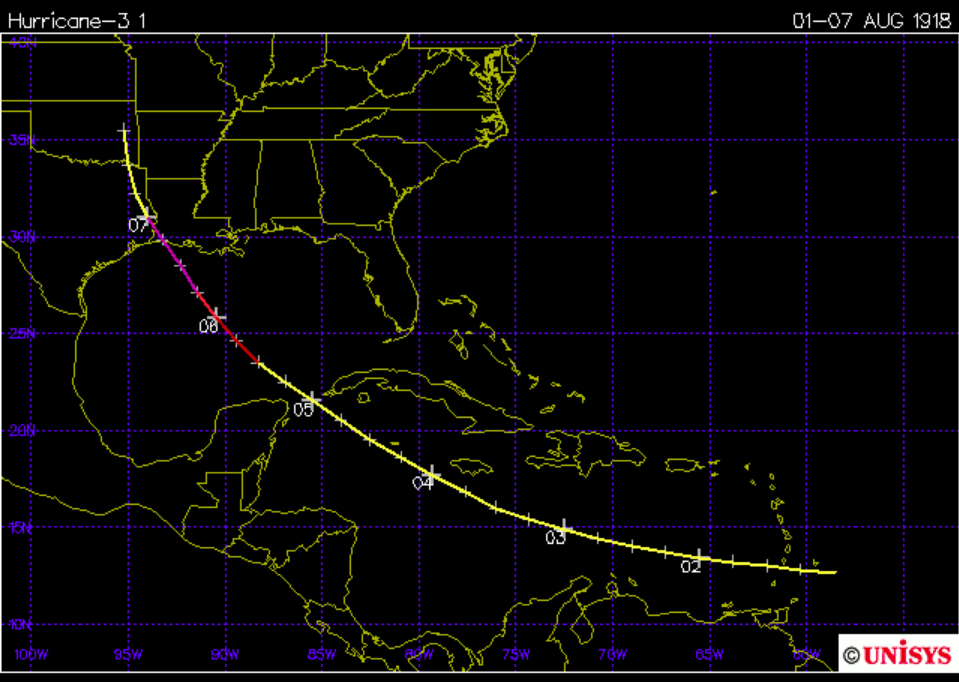
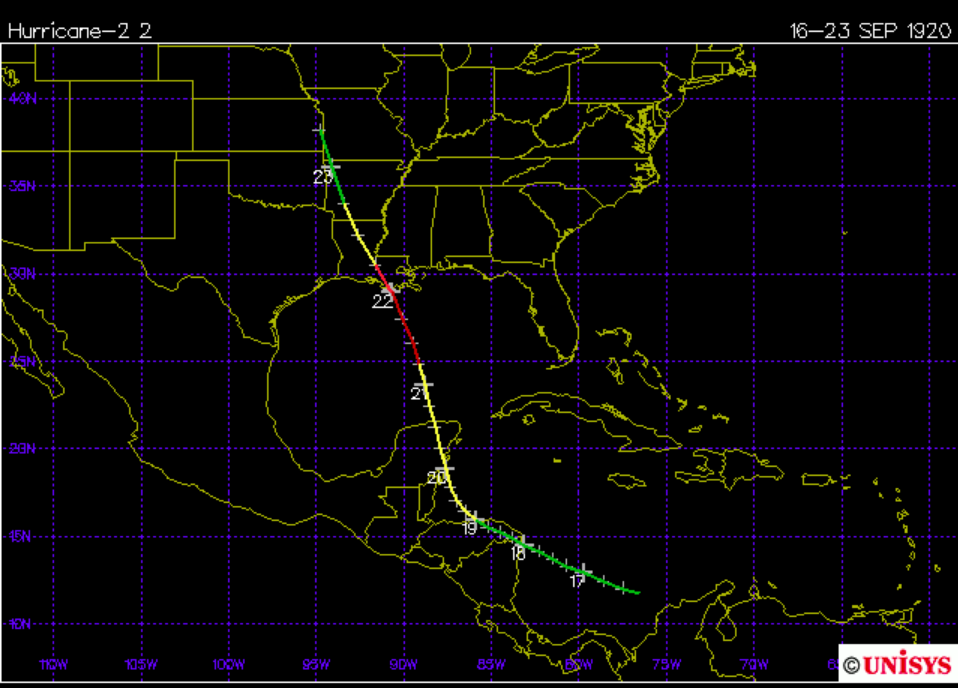
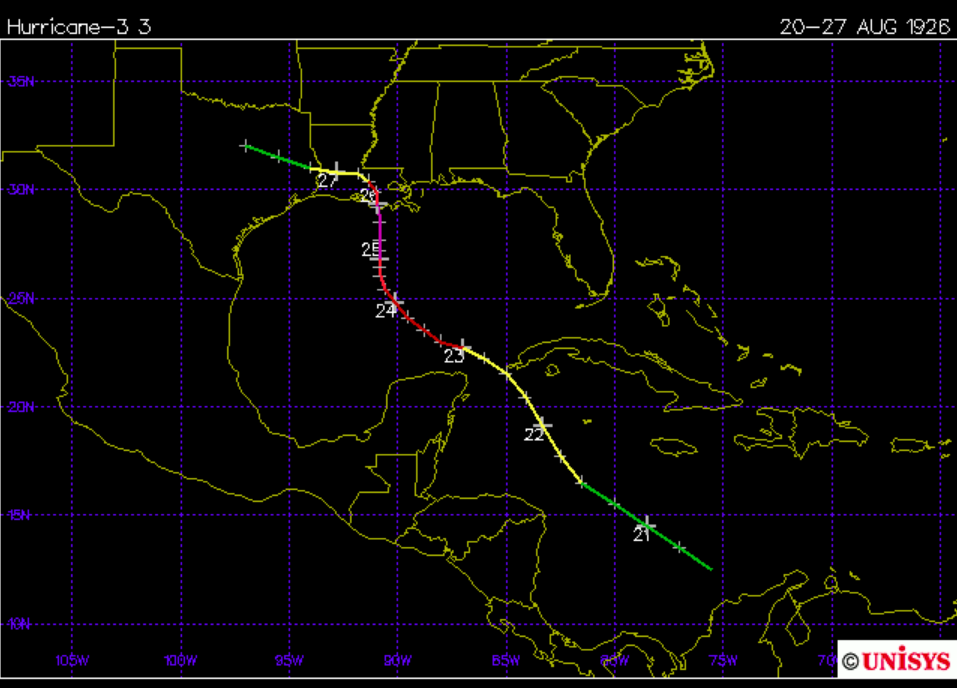
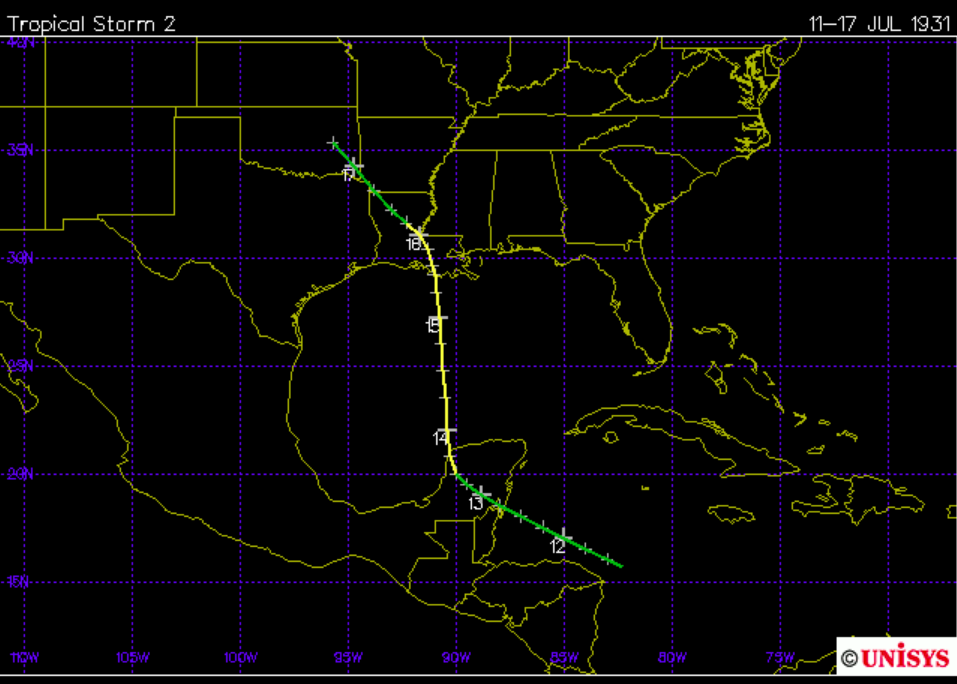
We are missing data for 11 hurricanes/ tropical storms that likely elevated the level of Lake Pontchartrain at Mandeville, but for which we do not yet have high water data. The 10 maps above, provided by Unisys Corporation, depict the tracks of these storms. At the present time, the website only provides 10 tabs so no map is available for Hurricane Lili (2002).
Local Partnership
The City of Mandeville, under Mayor Donald Villere, funded the development of U-Surge for their city. Special thanks to Louisette Scott, Director Mandeville's Department of Planning and Development.
The U-Surge project would like to dedicate this page to the loving memory of Dr. Ezra Boyd, a hazards geographer who had a kind heart and gladly served those around him. Ezra called Mandeville home. He is missed but not forgotten!
The U-Surge project would like to dedicate this page to the loving memory of Dr. Ezra Boyd, a hazards geographer who had a kind heart and gladly served those around him. Ezra called Mandeville home. He is missed but not forgotten!
Storm Surge Multimedia
Note: All of these pics/ video were taken in the Mandeville area
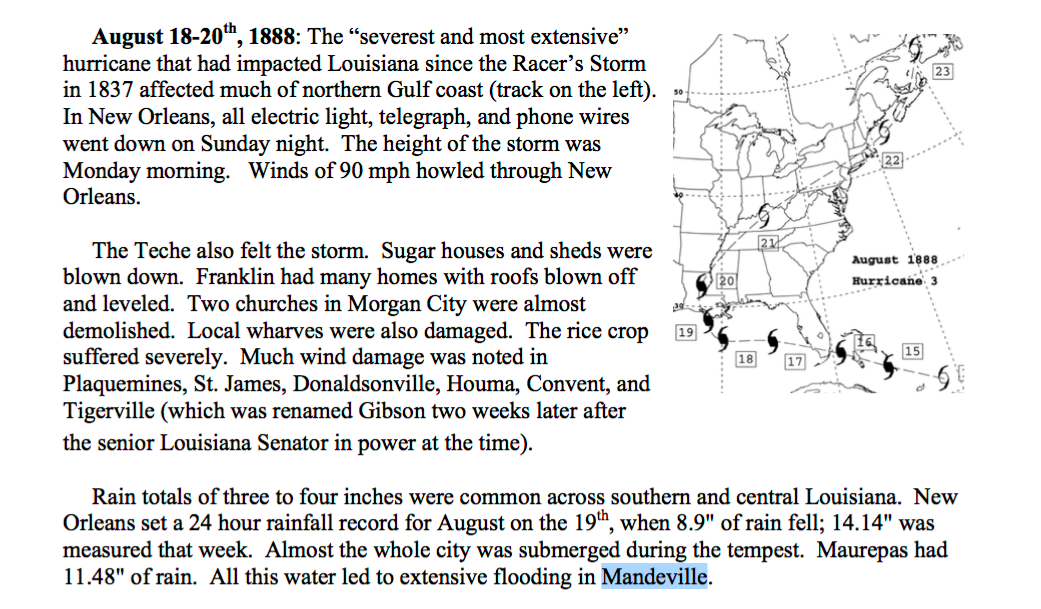
Evidence of a substantial compound (surge + rain) flood event in Mandeville in 1888.
Source: http://www.wpc.ncep.noaa.gov/research/lahur.pdf.
Source: http://www.wpc.ncep.noaa.gov/research/lahur.pdf.
Multi-media for Hurricane Rita (2005) are not yet available...
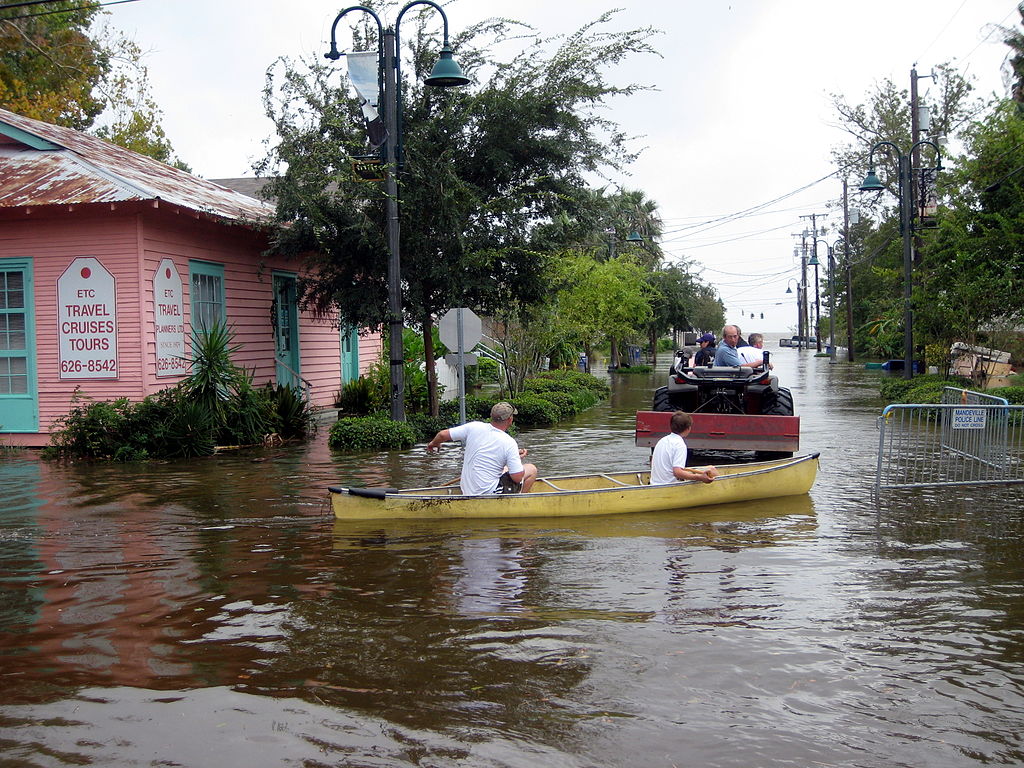
"Girod Street during the Hurricane Ike flood in 2008"
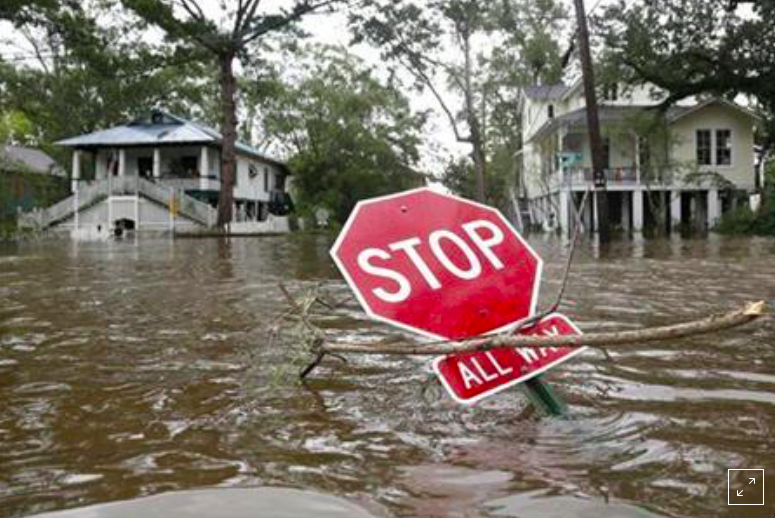
A stop sign is seen on a flooded street after Hurricane Isaac hit Mandeville, Louisiana, August 30, 2012. REUTERS/Jonathan Bachman. Click to see link.
Additional Resources
Map of hurricanes that impacted Lake Pontchartrain between 1947-1998.
Link: https://pubs.usgs.gov/of/2002/of02-206/phy-environment/recent-hurricanes.html
Link: https://pubs.usgs.gov/of/2002/of02-206/phy-environment/recent-hurricanes.html